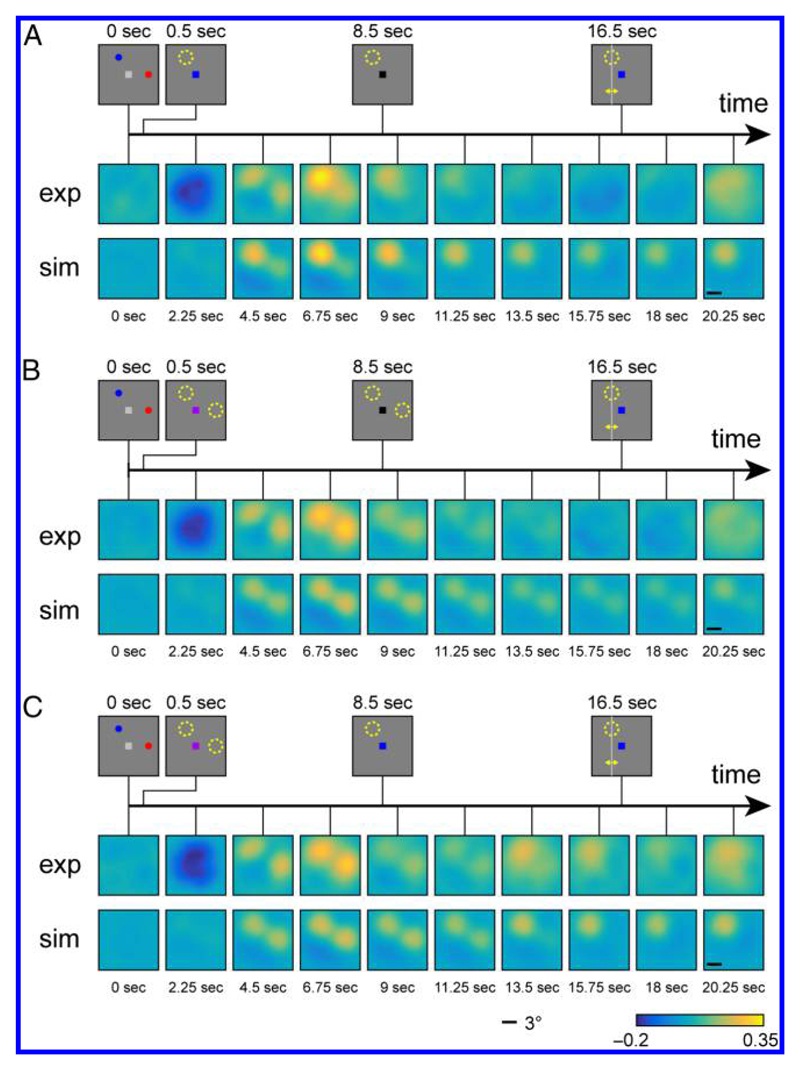
Figure 4.
Two-dimensional reconstructions of spatial activation patterns in the R1 condition (A), R2-neutral condition (B), and R2-valid condition (C). In each panel, the stimulus displays for different phases of the trial are shown at the top. The first row shows reconstructions from the fMRI study (Sprague et al., 2016); the second row shows reconstructions from neural model simulations.

