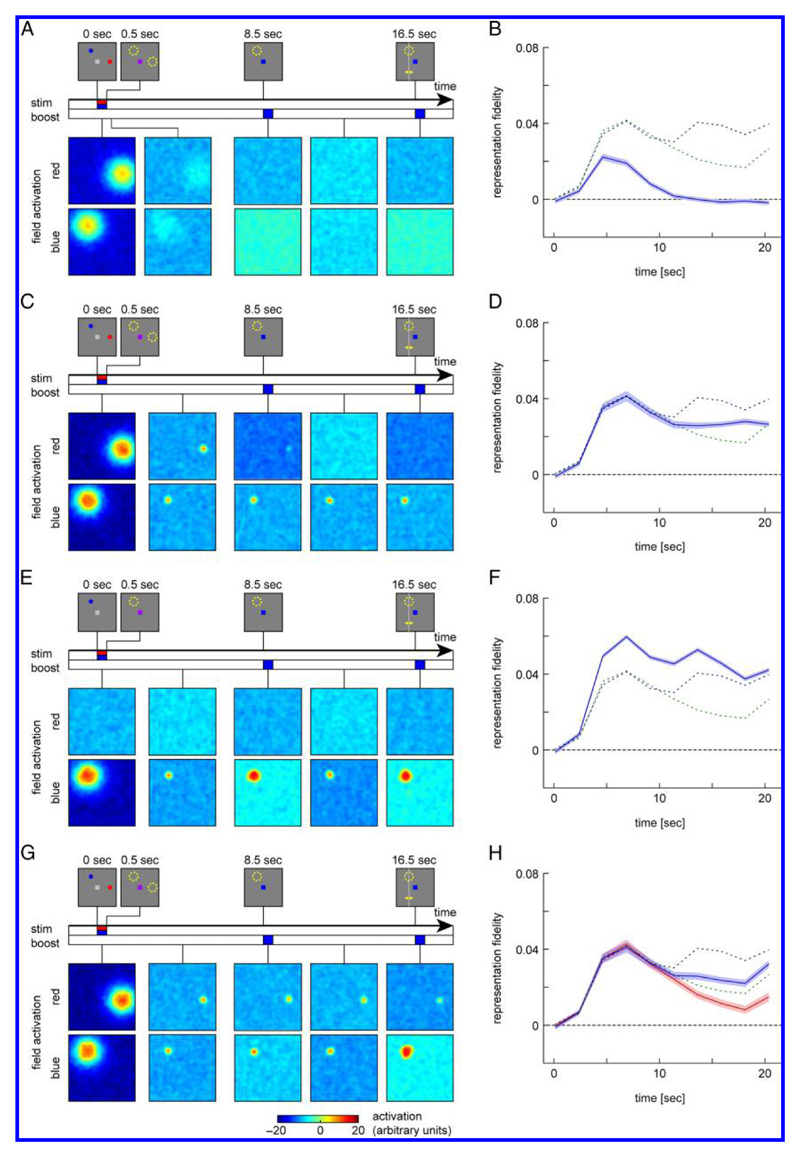
Figure 7.
Evolution of activation patterns and fidelity time courses in model simulations for different model and task variants based on the original R2-valid condition. (A, B) Neural model without lateral excitatory interactions. (C, D) Model variant with color cue realized through inhibition of noncued items. (E, F) Task variant with only the target item presented in the sample array. (G, H) Model variant with weak (unreliable) retro-cue input. The field activations are shown for the case of a valid retro-cue; fidelity plots are shown for both valid (blue) and invalid (red) retro-cue. The dashed lines in the fidelity plots show the mean fidelity from the original R2-valid (blue) and R2-neutral condition (green) for comparison. Shaded areas in fidelity plots indicate 95% confidence interval based on resampling.

