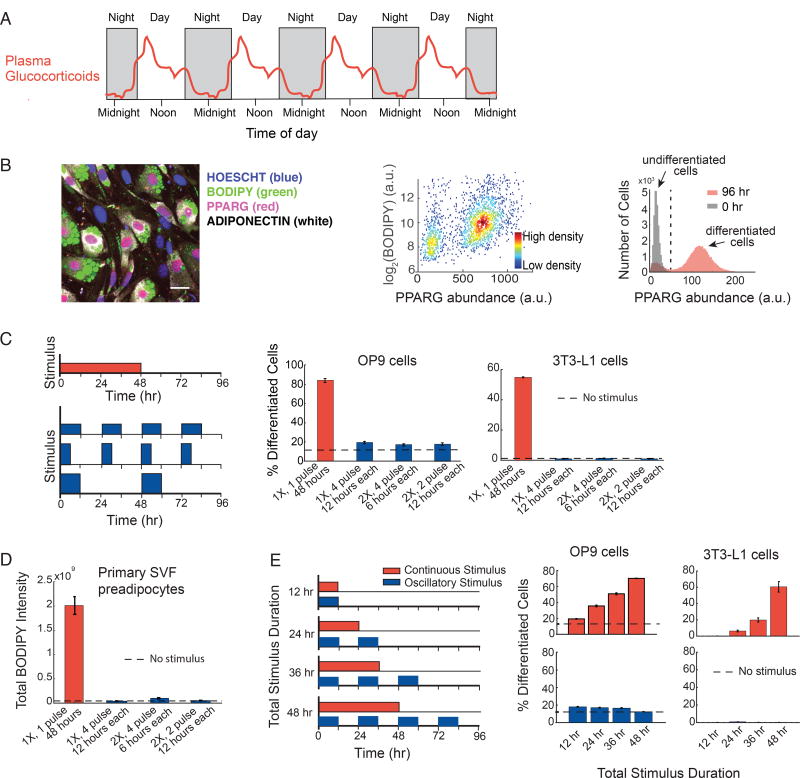
Figure 1. Preadipocytes reject circadian and rhythmic glucocorticoid stimuli.
(A) Schematic depicting averaged glucocorticoid time courses in humans (adapted from Weitzman et al, 1971).
(B) Single-cell immunofluorescence assay used to quantitate percent of differentiated cells based on (Park et al., 2012). Preadipocyte cells were fixed and stained with Hoechst to visualize nuclei (blue), BODIPY to visualize lipids (green), and antibodies against PPARG (red) and adiponectin (white). The latter 3 signals are closely correlated in individual cells. Images show mouse OP9 cells. Scale bar, 10 µm. Scatter plot shows that high-PPARG cells display mature fat cell features and accumulate high levels of lipid. Application of an adipogenic stimulus causes cells to split into two populations with low and high PPARG. The middle of the trough between the bimodal PPARG intensity peaks (black dotted line in histogram) was used to separate undifferentiated and differentiated cells. Percent of differentiated cells was assessed at t = 96 hours after applying adipogenic stimulus, using approximately 7,000 cells per technical replicate. See also Figures S1A–S1C.
(C) Different patterns of DMI stimuli were applied to OP9 and 3T3-L1 preadipocyte cells: 48 hours continuous delivery (red) and 3 different pulsatile protocols (blue): 12 hours on/12 hours off, 6 hours on/18 hours off, and 12 hours on/36 hours off. The concentration of DMI stimulus used for a 48-hour continuous pulse was 1µM dexamethasone (dex), 250 µM IBMX, and 1.75 nM insulin. To keep the total amount of stimuli, i.e. area under the curve, constant for all 4 protocols over the 96-hour experimental timeframe, the concentration of dex and IBMX was increased proportionally to compensate for decreases in pulse duration. To end a pulse, the DMI-containing media was aspirated, cells were washed gently three times with fresh media, and the cells were left in media with no glucocorticoids or IBMX, but containing 1.75 nM insulin. The dashed line shows the percent of differentiated cells when no stimulus was applied and cells were placed for the whole 4-day timecourse of differentiation in media with no glucocorticoids or IBMX, but containing 1.75 nM insulin.
(D) Experiments in primary SVF preadipocytes show that the same filtering effects are also observed in primary cells. SVF preadipocytes were plated into 96-well wells and induced to differentiate using the same pulsing protocols from (C). The Total BODIPY Intensity in each well was measured by imaging.
(E) Applying continuous stimuli with durations greater than 12 hours resulted in corresponding increases in the number of differentiated OP9 and 3T3-L1 cells. However, the same total stimuli given in circadian pulses resulted in only minimal differentiation.
(C–E) Barplots represents mean +/− s.e.m. from 3 technical replicates. All data shown are representative of 5 independent experiments.

