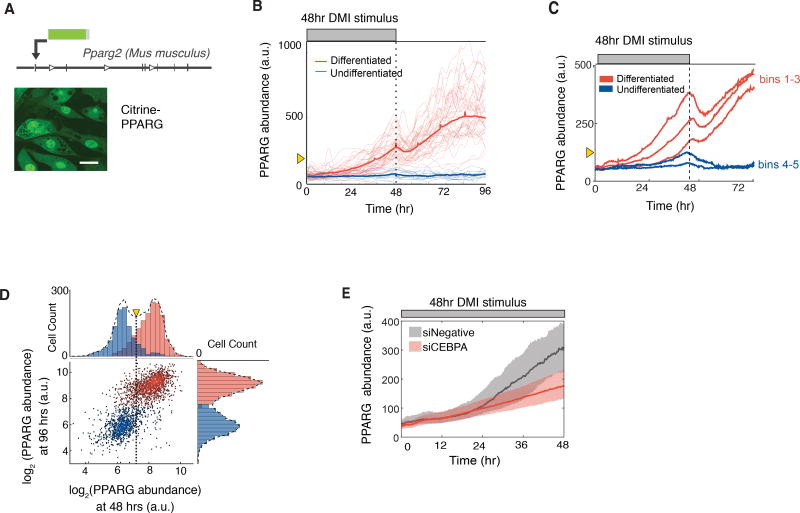
Figure 3. PPARG levels increase slowly and typically do not reach the threshold to differentiate unless hormone stimuli are applied for longer than 24 hours.
(A) Endogenous PPARG2 in OP9 cells was tagged with citrine (YFP) using CRISPR-mediated genome editing. Scale bar, 5 µm.
(B) Identifying a PPARG threshold for differentiation by carrying out live-cell imaging of citrine-PPARG cells induced to differentiate with the standard DMI protocol. When the DMI stimulus is removed at 48 hours, cells either sustain or lose the increase in nuclear PPARG intensity (PPARG abundance). The thin lines show 50 representative single cell traces, and the bold line shows the population mean of 500 cells. Cells that differentiated after 96 hours are marked in red, and cells that stayed in the preadipocyte state are marked in blue. The yellow triangle shows the threshold calculated in Figure 3D.
(C) Timecourses from 419 cells were divided into 5 groups (bins) according to their PPARG level at 48 hours, and the average of each bin was plotted. An initial drop was seen in each averaged timecourse after DMI removal, resulting in a return to the basal state for cells that had lower levels of PPARG and a delayed increase to the maximal state in cells that had higher levels of PPARG.
(D) Scatter plot comparing the level of PPARG in the same cell measured at 48 hours just before DMI is removed and at 96 hours when PPARG levels reach their plateau in differentiated cells. The color of the dots and histograms mark cells that will be differentiated (red) or not differentiated (blue) at 96 hours, respectively. The histograms on top shows the existence of a clear PPARG threshold already at 48 hours before the stimulus is removed (marked with yellow triangle and dotted line) that can distinguish between cells that will go on to differentiate from those that will not.
(E) Live-cell imaging of citrine-PPARG cells transfected with CEBPA-targeting or control siRNA shows that knockdown of CEBPA, a main feedback partner of PPARG, prevents cells from reaching the threshold to differentiate. Cells were induced to differentiate with the standard DMI protocol. Plotted lines are population median traces with shaded regions representing 25th and 75th percentiles of approximately 700 cells per condition.

