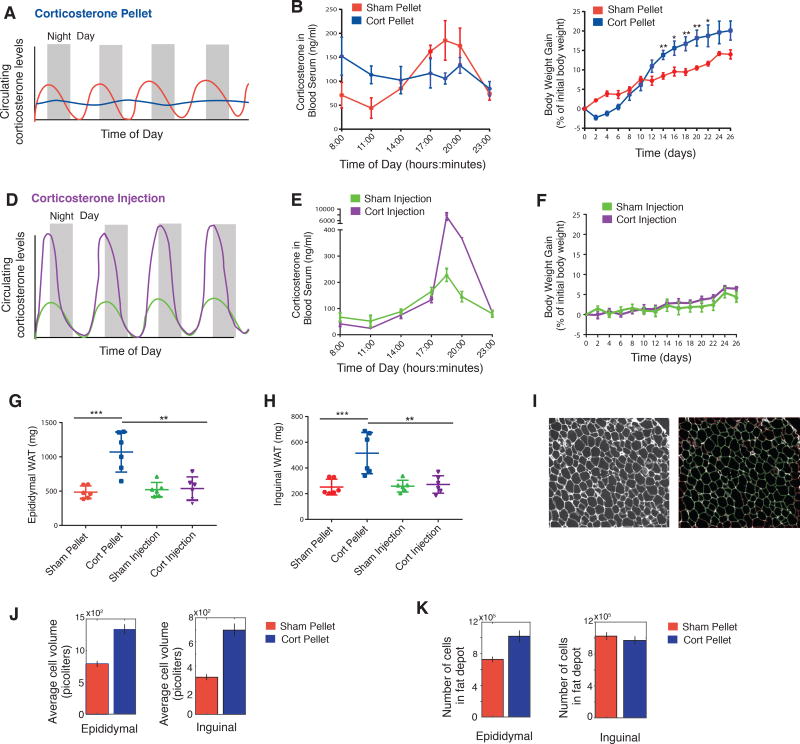
Figure 7. Animals implanted with Corticosterone (Cort) pellets that caused sustained, flattened elevations in Cort showed significant increases in adipose tissue mass compared to animals with normal circadian Cort osillations.
(A) Schematic of expected flattening (blue curve) of glucocorticoid oscillations in animals with Cort pellet implantation.
(B) Timecourse of average Cort levels in mice implanted with Cort pellets compared to mice implanted with Sham pellets. N=3, mean +/− s.e.m.
(C) Timecourses showing weight of mice implanted with Cort pellets compared to mice implanted with Sham pellets. N=6, mean +/− s.e.m. Unpaired t-test (Sham pellet vs. Cort pellet): * p < 0.05, ** p < 0.01. Chow intake during the 26 days per mouse was 73.9 and 70.9 grams for Sham-pellet and Cort-pellet mice, respectively (see Table S7).
(D) Schematic of daily injection protocol to selectively increase peak amplitudes of Cort in animals.
(E) Peak amplitudes of Cort are greater than 40-fold higher for mice injected daily with Cort compared to mice Sham-injected daily with phosphate buffer solution (PBS). N=3, mean +/− s.e.m.
(F) Timecourses showing weight of mice injected daily with Cort compared to Sham-injected daily with PBS. N=6, mean +/− s.e.m. Chow intake during the 26 days per mouse was 68.2 and 74.0 grams for PBS-injected and Cort-injected mice, respectively (see Table S7).
(G and H) The weights of both the Epididymal (visceral) and Inguinal (subcutaneous) fat depots were significantly increased for the Cort pellet group but not for the other 3 groups of mice. N=6, mean +/− s.d. Unpaired t-test: * p < 0.05, ** p < 0.01, *** p < 0.001.
(I) A custom cell contour image analysis program written in MATLAB was used to automatically measure adipocyte size from H & E stained fat tissue slices. Left, example of original H & E image. Right, segmented image showing identified adipocytes in green. Cells touching borders or not meeting shape criteria were excluded.
(J–K) Barplots of the average cell volume (J) and number of cells (K) in the Epididymal and Inguinal adipose fat depots in mice treated with Sham or Cort pellets for 21 days. The number of cells were derived by dividing total fat depot weight by the average cell volume. Each bar represents ~10,000 adipocytes analyzed from 90 images per condition (6 mice with either implanted Sham or Cort pellets × 3 tissue sections per mouse of either Epididymal or Inguinal fat × 5 images per section). Error bars show s.e.m. based on 90 images.

