
Figure 2. Tissue specificity of long intergenic non-coding RNA (lincRNA) expression.
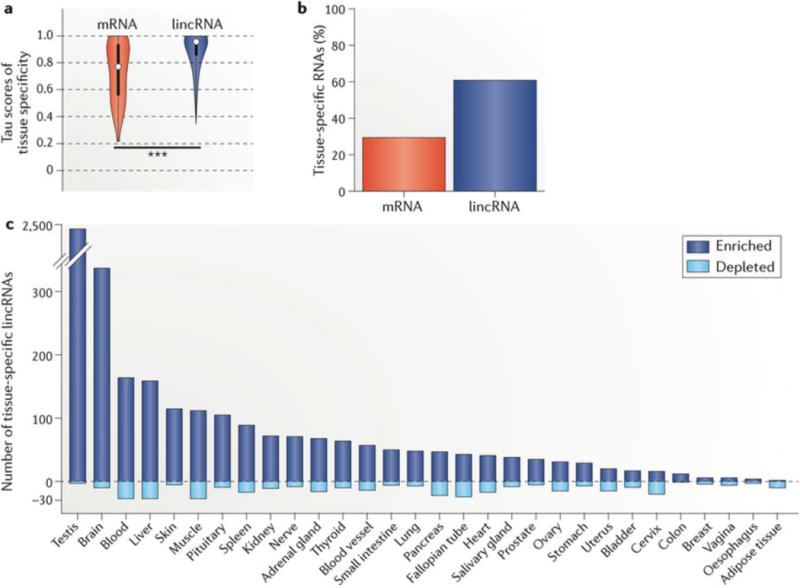
a | We calculated the individual tau (tissue specificity) scores, which range from 0 to 1 (0 for uniform expression; 1 for single-tissue expression), of 7,842 lincRNAs (blue) and 22,285 mRNAs (red) across 30 human tissues from the GTEx Analysis v6 data set (dbGaP Accession phs000424.v6.p1 based on GENCODE v19 (hg19; July 2013)). We additionally calculated tau scores after permutation of each RNA to its assigned tissue to estimate the false discovery rate (FDR). The results are depicted as a violin plot of tau score distributions, demonstrating greater tissue specificity for lincRNAs than mRNAs (median 0.90 for lincRNA; 0.77 for mRNA; 0.47 for permutation; one-sided Wilcoxon test, ***P < 0.001). The white dots represent the median; thick and thin bars represent one or two standard deviations from the median, respectively. b | Proportion of lincRNAs and mRNAs that are tissue-specific by tau score. c | For each lincRNA with significant tissue specificity (tau >0.88; FDR <0.05 by permutation distribution), we re-calculated its tau score 30 additional times, each time excluding one tissue to estimate the individual contribution of the tissue. If tissue specificity no longer reached significance with exclusion of one tissue, we designated the lincRNA as specific to that tissue. Given that such a lincRNA may have tissue specificity through enrichment or depletion, we also calculated the direction of its contribution (one-sided Student’s t-test, P < 0.05). Shown is the number of lincRNAs with a distinct expression signature in a single tissue owing to enrichment (positive y axis) or depletion (negative y axis), which highlights the abundance of tissue-specific lincRNAs in the testis and brain.