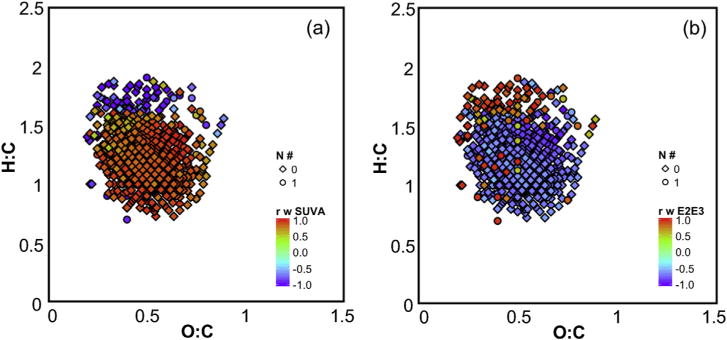
Fig. 6.

Pearson correlation coefficients calculated between the relative intensity of common FT-ICR MS CHO and CHON formulas and (a) SUVA254 or (b) E2:E3. The analysis was conducted using negative mode formulas in all samples excepting the Ostara influent and effluent. Only formulas with r ≤ −0.5 or ≥ 0.5 are shown.
