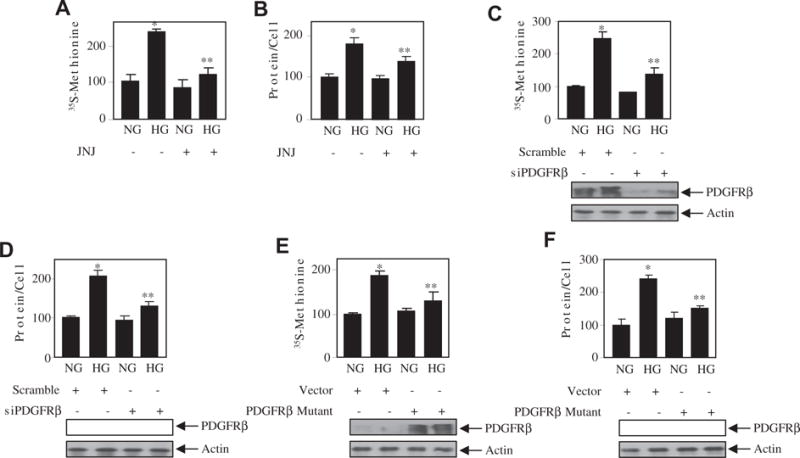
Fig. 3.

PDGFRβ controls mesangial cell hypertrophy by high glucose. (A and B) Mesangial cells were treated 0.1 μM JNJ for an hour prior to incubation with high glucose (HG) for 24 h. Protein synthesis was measured by 35S-methionine incorporation as described in the Materials and methods section (panel A). Mean ± SE of triplicate measurements is shown. *p < 0.01 vs NG; **p < 0.01 vs HG. Hypertrophy was determined as the ratio of total amount of protein to cell number as described. Mean ± SE of 6 measurements is shown. *p < 0.001 vs NG; **p < 0.05 vs HG [22,25]. (C–F) Mesangial cells were transfected with siPDGFRβ or scramble (panels C and D) or PDGFRβ mutant (Y740/751F) or vector (panels E and F). The transfected cells were incubated with normal glucose (NG) or high glucose (HG) for 24 h. The protein synthesis and hypertrophy were determined as described above. Mean ± SE of 3–6 measurements is shown. *p < 0.01 vs HG. For panels B and E, **p < 0.05 vs HG; for panels C, D and F, **p < 0.01 vs HG. The bottom panels show the expression of PDGFRβ and actin.
