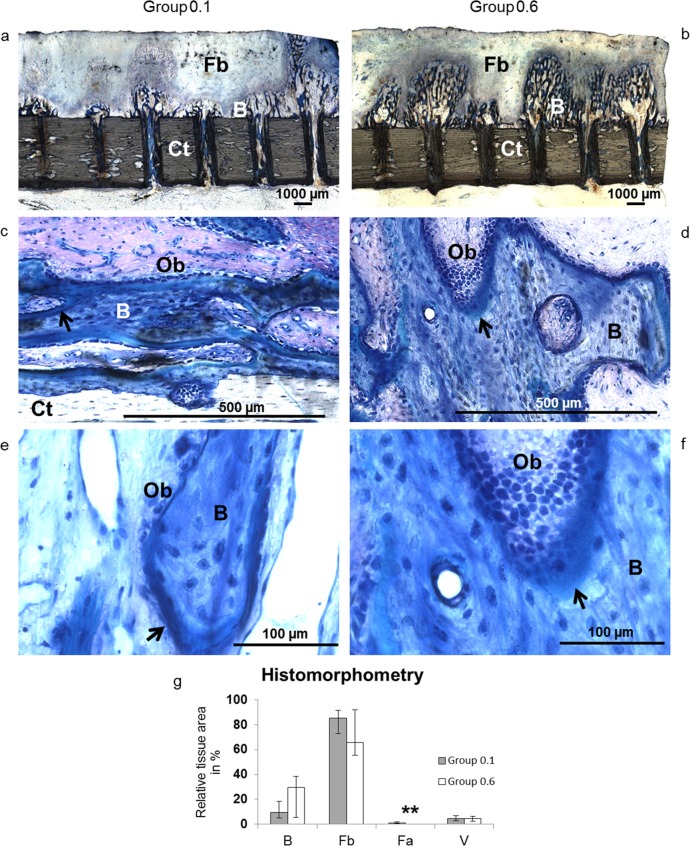
Fig 5.
a-g. Undecalcified histology and histomorphometry. The representative histological images of Group 0.1 (left) and Group 0.6 (right) show spicules of newly formed bone (B) ascend from the cortex (Ct) into the regenerate gap in line of the medullary bore holes (Fig 5A and 5B). A faint layer of mesenchymal condensations covers the spicules and converts to fibrous tissue (Fb). There is no indication of endochondral ossification. At higher magnifications, animals from Group 0.1 (Fig 5C and 5E) and Group 0.6 (Fig 5D and 5F) show osteoblasts (Ob) lining layers of osteoid (arrows) around trabeculae of newly formed bone (B). 12.5-fold (a-b), 200-fold (c-d) and 400-fold (e-f) magnification. Histomorphometry (Fig 5G) shows differences of bone (B), fibrous tissue (Fb), fat cells (Fa, **p = 0.008) and vessels (V) between groups (grey bar: Group 0.1, white bar: Group 0.6; data given as median and range).

