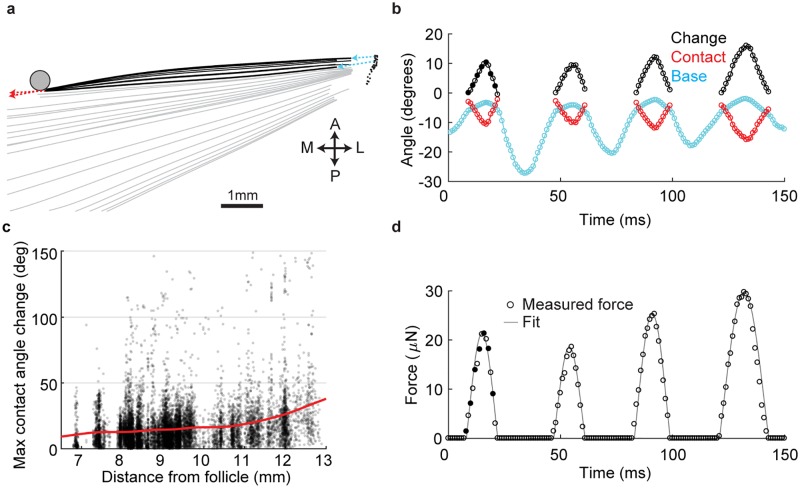
Fig 2. Quantification of active whisker touch.
A, Time-series of a tracked whisker before, during and after a typical pole touch. Non-contact periods in gray, contact periods in black. Black dots, estimated base of follicle. Arrows indicate base whisker angle (cyan) and whisker angle at contact point (red). B, Example set of whisker-pole touches. Whisker angle at base (cyan) and at contact point (red). The change in the difference of base angle and contact angle from onset of each touch (black). Time points for traces during contact displayed in (A) are indicated as solid circles. C, Distribution of the maximum change in base-contact angle for 12,361 exploratory (pre-decision) protraction touches across a range of pole distances during object localization. Smoothed spline fit (red). Data from Hires et al. 2015. D, Estimated quasi-static force generated by the four touches in B, using the methodology of Pammer et al., 2013.

