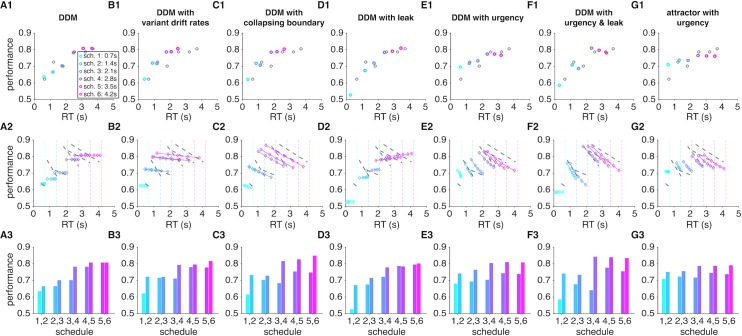
Fig 5. Simulations of experimental data in Experiment 1 using various models.
Model simulations reveal that our data are more compatible with either leaky integration of sensory information with an additional urgency signal or sensory integration based on stochastic transitions modulated by an urgency signal. Results for different models are presented on different columns, while panels 1 to 3 of each column plot the average speed-accuracy tradeoff for a given level of time pressure (panel 1); performance as function of proximity to the deadline (panel 2); and the average performance on RT-matched trials (based on mean) with adjacent levels of time pressure (panel 3). The parameters for each model are determined based on the best fit of data in Fig 2C. For these simulations and fits, trials in which the decision boundary was not crossed before the deadline were removed from the analysis. The gray circles in the first column and dashed lines in the second column show the experimental results and linear regression fits of performance as a function of RT, respectively. Models include: basic DDM (A); DDM with variant drift rates (B); DDM with collapsing boundary (C); DDM with leak (D); DDM with urgency (E); DDM with urgency and leak (F); and attractor model with urgency (G). Conventions are similar to Fig 2.

