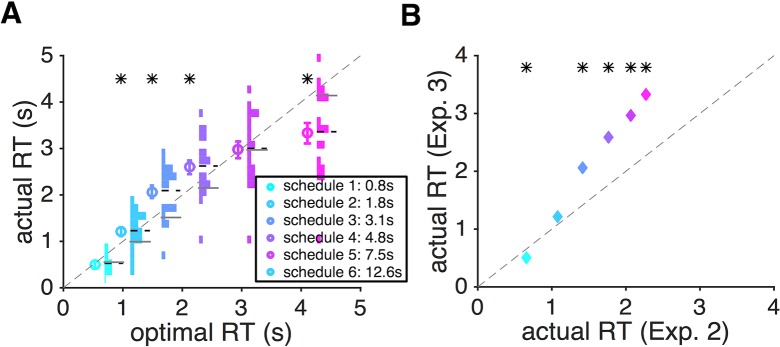
Fig 8. Different patterns of response time between the time-dependent gambling task (Experiment 3) and dynamic combination of sensory and reward information (Experiment 2, Fig 7C).
(A) Comparison between the actual RT and the predicted optional RT in Experiment 3. Conventions are the same as in Fig 7C. (B) Comparison between the average RT in Experiments 2 and 3. Overall, subjects showed larger RT in Experiment 3 for slower schedules. The asterisk indicates statistical significance for the difference between actual and optimal RT in panel A, and actual RT between Experiments 2 and 3 in panel B (two-sided sign test, p < 0.05).

