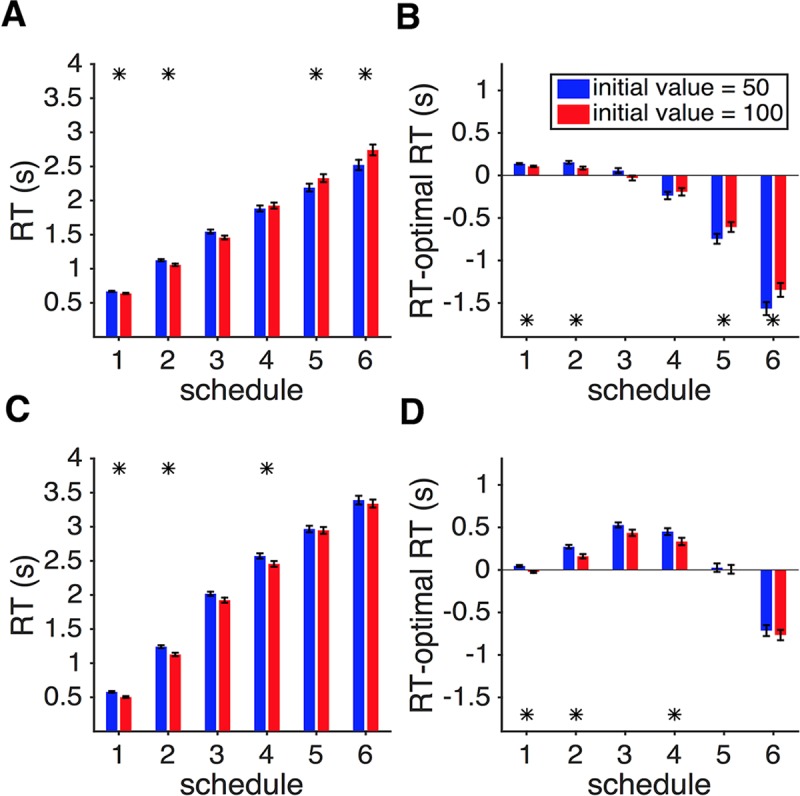
Fig 9. The effect of initial reward value on dynamic combination of sensory and reward information.

(A) For schedules with greater levels of time pressure, a larger initial reward value (red) resulted in faster RT (schedules 1 and 2) than a smaller initial reward value (blue), but the opposite was true for schedules with smaller levels of time pressure (schedules 5 and 6). Plotted is the median RT separately for each level of time pressure and initial reward value in Experiment 2. Error bars show the s.e.m. The asterisk indicates a significant difference in RT between the two initial reward values (two-sided sign test, p < 0.01). (B) The median of the difference between the actual RT and optimal RT is plotted separately for each level of time pressure and initial reward value in Experiment 2. Overall, a larger initial reward value made RT closer to optimal. (C, D) The same as in (A, B) but for Experiment 3. Overall, RT was larger for trials with a smaller initial reward value in all schedules, indicating that subjects waited longer to reach a higher probability for accepting an initially smaller reward.
