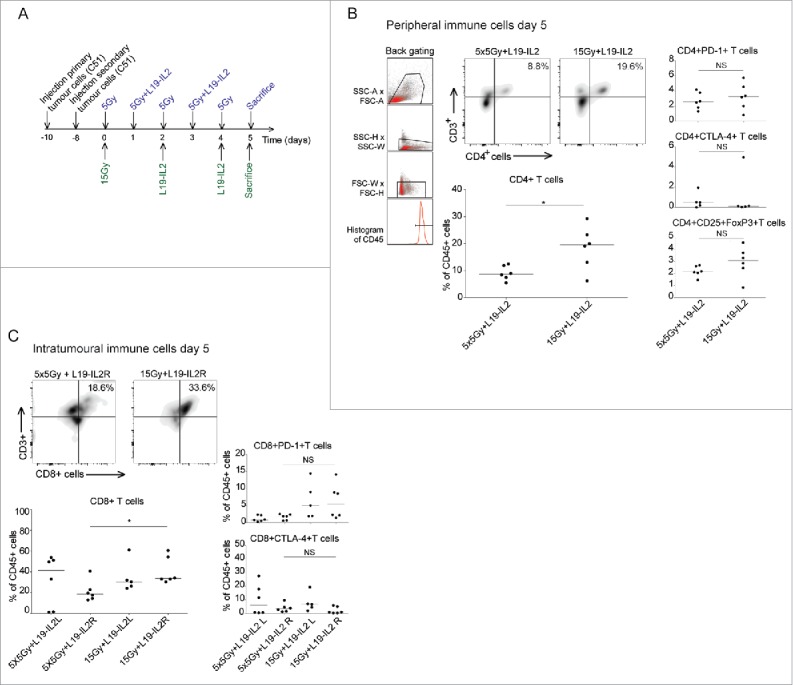
Figure 4.

Immunological responses after single doses and fractionated irradiation. (A) Experimental setup and schedule for immunological analysis of tumours and blood. Representation and quantification of percentages of CD4+, CD4+ PD-1+, CD4+ CTLA-4+ and CD4+FoxP3+CD25+ T cells of total peripheral (B) and tumour infiltrating (C) CD45+ immune cells. *p < 0.05. Bars represent median.
