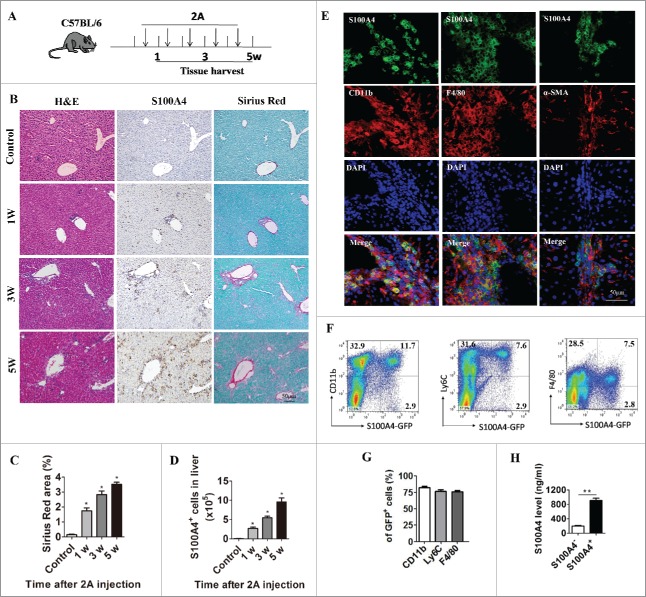
Figure 2.
Anti-CD137 mAb treatment induce the infiltration of a large number of S100A4+ macrophages. (A) Schematic representation of the 2A-induced chronic liver injury model. 6-week-old C57BL/6 mice were treated with 100 µg 2A or RatIg weekly for 5 weeks. Liver tissue was harvested at the indicated time points for further observation. (B) Histological characterization of liver fibrosis and S100A4+ cell accumulation. Consecutive sections were stained with H&E, Sirius Red, or the anti-S100A4 antibody. Scale bar, 50 μm. (C) Quantification of Sirius Red areas in the liver sections. *p < 0.05. (D) To detect the number of S100A4+ cells that infiltrated the liver, S100A4+/+.GFP transgenic mice were treated with 2A as described above. Total numbers of GFP+ cells in the liver (calculated by multiplying the absolute number of liver non-parenchymal cells by the percentage of GFP+ cells) of the untreated (control) or 2A-treated mice at each time point were monitored. Statistical analysis was performed to compare the control group and the 2A-treated groups at different time points (n = 3 per group) after 2A injections. *p < 0.05. (E) Double immunohistochemical (IHC) staining of S100A4 (green) with CD11b, F4/80, or α-SMA in the liver tissue. Nuclei were counter-stained with DAPI (blue). Note that most of the S100A4+ cells were also positive for CD11b and F4/80 (yellow), but not α-SMA. Scale bar, 50 μm. (F-G) Flow cytometry analysis of the phenotypes of S100A4+ cells in the liver of S100A4+/+.GFP mice treated with 2A by staining GFP+ cells with CD11b, Ly6C and F4/80 antibodies. (H) S100A4 concentrations in the cultured supernatant of S100A4+ CD11b+ cells or S100A4− CD11b+ cells as detected by ELISA. **p < 0.01.

