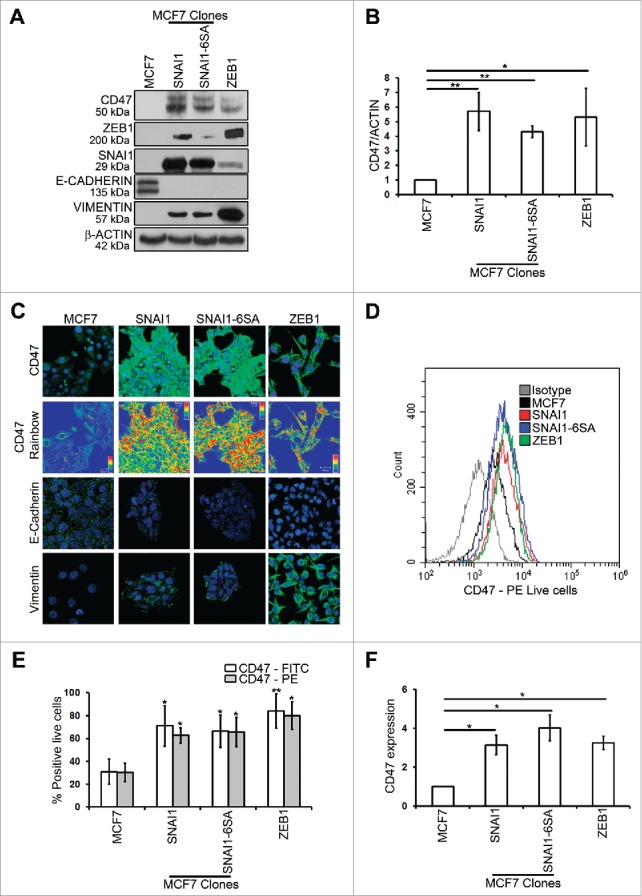
Figure 2.

MCF7 SNAI1, MCF7 SNAI1–6SA and MCF7 ZEB1 EMT-activated cells selectively upregulate CD47 as compared with epithelial MCF7 cells.(A) Western blot was performed to show CD47, ZEB1, SNAI1, E-CADHERIN, VIMENTIN and β-ACTIN protein levels. (B) Densitometry was performed to compare CD47 protein levels. The experiment was repeated 5 times. (C) Confocal microscopy analysis of CD47, E-CADHERIN and VIMENTIN expression (in green) in indicated cells. CD47 Rainbow panel indicates CD47 staining intensity (blue to red corresponds to low to high intensity respectively). Nuclei were counterstained with DAPI (in blue). Magnification 40X, bar: 20 μm. The experiment was repeated 6 times. (D and E) Surface expression of CD47 (using 2 different antibodies: Human CD47 PE-conjugated Antibody and Anti-Human CD47 FITC) on live cells was evaluated by flow cytometry as compared with isotype control (gray-shaded histogram). The experiment was repeated 6 times. (F) SYBR-GREEN RT-qPCR was used to monitor CD47 mRNA expression. The experiment was performed in triplicate and repeated 3 times.
