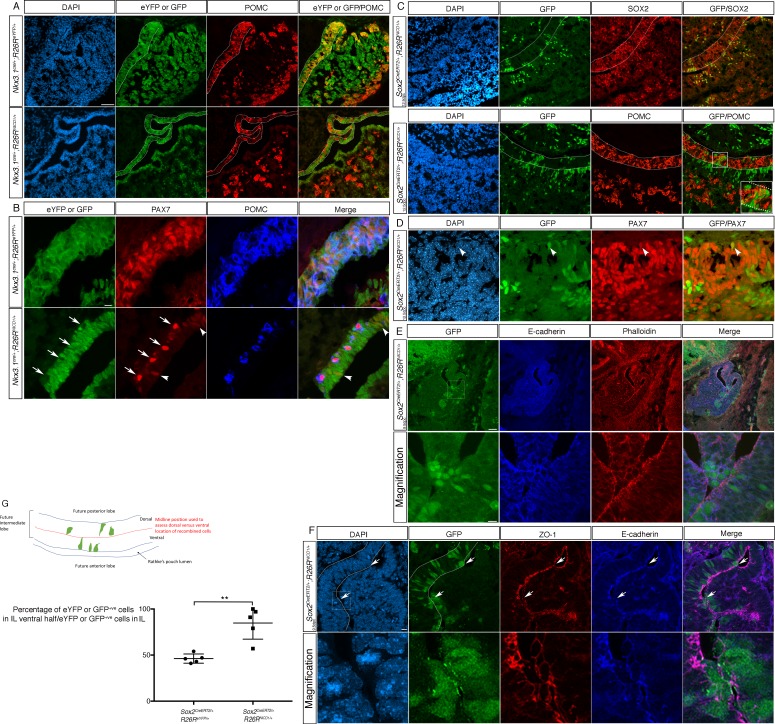
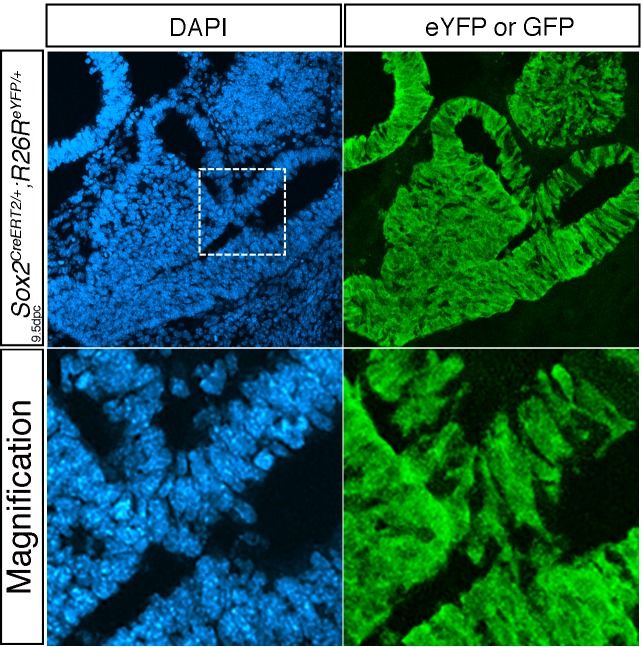
Figure 2. Differential timing of NOTCH activation IL progenitors has contrasting phenotypic consequences.
(A) Immunofluorescence of 18.5dpc Nkx3.1Cre/+;Rosa26ReYFP and Nkx3.1Cre/+;Rosa26flSTOPNICD1/+ pituitaries. NICD1iresGFP positive cells do not express POMC in contrast with eYFP positive cells in control embryos. (B) Immunofluorescence of 18.5dpc Nkx3.1Cre/+;Rosa26ReYFP and Nkx3.1Cre/+;Rosa26flSTOPNICD1/+. In control embryos, IL melanotrophs express PAX7 and POMC while NICD1iresGFP positive cells in mutants are unable to upregulate POMC. Some show low levels of PAX7 expression (arrowhead) suggesting commitment toward melanotroph fate. A few cells upregulate PAX7 and POMC in mutants, but are NICD1iresGFP negative non-recombined cells (arrows). (C, D) Immunofluorescence of 18.5dpc Sox2CreERT2/+;Rosa26flSTOPNICD1/+pituitaries induced at 12.5dpc. NICD1iresGFP positive cells are now observed in IL. These express SOX2, but are POMC negative (high magnification inset). Similarly to what is observed in Nkx3.1Cre/+;Rosa26flSTOPNICD1/+embryos, some NICD1iresGFP cells express PAX7 (D, arrowhead). (E) Immunofluorescence of 12.5dpc Sox2CreERT2/+;Rosa26flSTOPNICD1/+ induced at 9.5dpc. Lower panel represents a magnification of the boxed area. NICD1iresGFP IL positive cells appear clustered ventrally toward AL. E-cadherin staining is lost from the apical membranes of NICD;GFP positive cells. F-actin is stained using phalloidin. (F) Immunofluorescence of 12.5dpc Sox2CreERT2/+;Rosa26flSTOPNICD1/+ induced at 9.5dpc. Lower panel represents a magnification of the boxed area. Expression of ZO-1, along with that of E-cadherin is lost/altered from the apical membranes of the NICD;GFP positive cells that are closest to the cleft. Therefore, both tight and adherent junctions appear abnormal in these cells, suggesting a loss of epithelial polarity. (G) Proportion of recombined cells located in the ventral half of IL in 12.5dpc Sox2CreERT2/+;Rosa26ReYFP and Sox2CreERT2/+;Rosa26flSTOPNICD1/+pituitaries induced at 9.5dpc. In control Sox2CreERT2/+;Rosa26ReYFP pituitaries, eYFP positive cells are homogeneously distributed in IL (n = 5 embryos, 58 (±8.5 SD) cells were counted/embryo). In contrast, 85% of NICD1iresGFP positive cells in mutant embryos are found in the ventral half of IL (n = 5 embryos, 29 (±23.6 SD) cells were counted/embryo). Unpaired t test performed, p=0.0045 after angular transformation of percentages. An annotated picture illustrates how cells were counted in dorsal and ventral IL. Scale bars represent 50 μm for A, C and D (upper panel), 20 μm for B and 10 μm for E (magnification) and F. IL is underlined.


