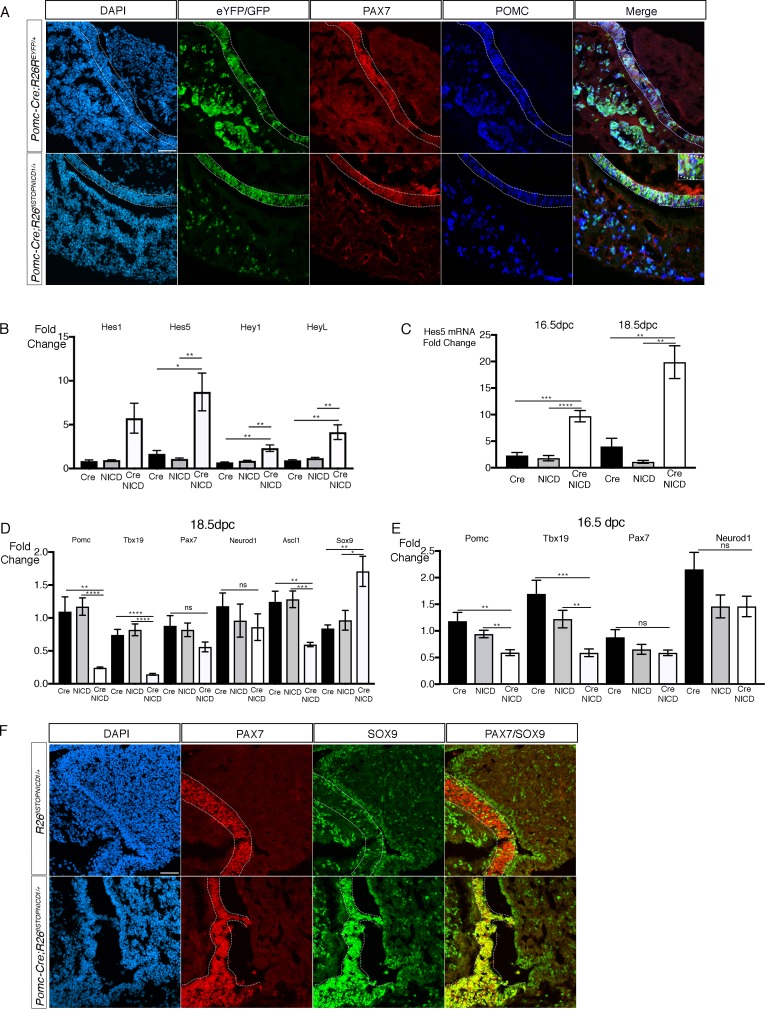
Figure 6. Activation of NOTCH pathway in the POMC lineage results in a gradual loss of differentiation markers in the embryo.
(A) Immunofluorescence of 18.5dpc Pomc-Cre;Rosa26ReYFP and Pomc-Cre;Rosa26flSTOPNICD1/+ pituitaries. In both control Pomc-Cre;Rosa26ReYFP and mutant Pomc-Cre;Rosa26flSTOPNICD1/+ embryos, the pattern of recombination appears similar. EYFP, in controls, and NICD1iresGFP positive cells in mutants co-express PAX7 and POMC (with high magnification inset), suggesting that cell fate acquisition is not altered. Fluorescence detection thresholds are identical between control and mutant. (B) RT-qPCR analysis of NOTCH pathway target genes in 18.5dpc pituitaries. There is a significant induction of Hes5, Heyl, and Hey1 expression following NICD expression (n = 3 to 4 pituitaries/genotype unpaired t test performed). (C) RT-qPCR analysis of Hes5 in 16.5 and 18.5dpc Pomc-Cre;Rosa26flSTOPNICD1/+ pituitaries. Levels of Hes5 are doubling between 16.5 and 18.5dpc (n = 4 to 7 pituitaries/genotype, unpaired t test performed). (D) RT-qPCR analysis of POMC lineage cell-type markers in 18.5dpc Pomc-Cre;Rosa26flSTOPNICD1/+ pituitaries. There is a significant reduction of POMC, Tbx19 and Ascl1 expression while Sox9 is up-regulated. In contrast expression of Pax7 and Neurod1 is not significantly affected (n = 4 to 6 pituitaries/genotype, unpaired t test performed). (E) RT-qPCR analysis of POMC lineage cell-type markers in 16.5dpc Pomc-Cre;Rosa26flSTOPNICD1/+ pituitaries. The same tendency is observed, but downregulation is milder, suggesting that gene expression is further altered as Hes5 induction becomes more robust (n = 5 to 7 pituitaries/genotype, unpaired t test performed). (F) Immunofluorescence of 18.5dpc Rosa26flSTOPNICD1/+ and Pomc-Cre;Rosa26flSTOPNICD1/+ pituitaries. In the control Rosa26flSTOPNICD1/+ section, PAX7 is present in melanotrophs, while SOX9 is restricted to stem cells lining the cleft in IL and AL, and glial cells in PL. PAX7 and SOX9 are hardly expressed by the same cells. In contrast, in Pomc-Cre;Rosa26flSTOPNICD1/+ there is a clear co-localisation of SOX9 and PAX7 in IL. Scale bar represents 50 μm. IL is underlined.


