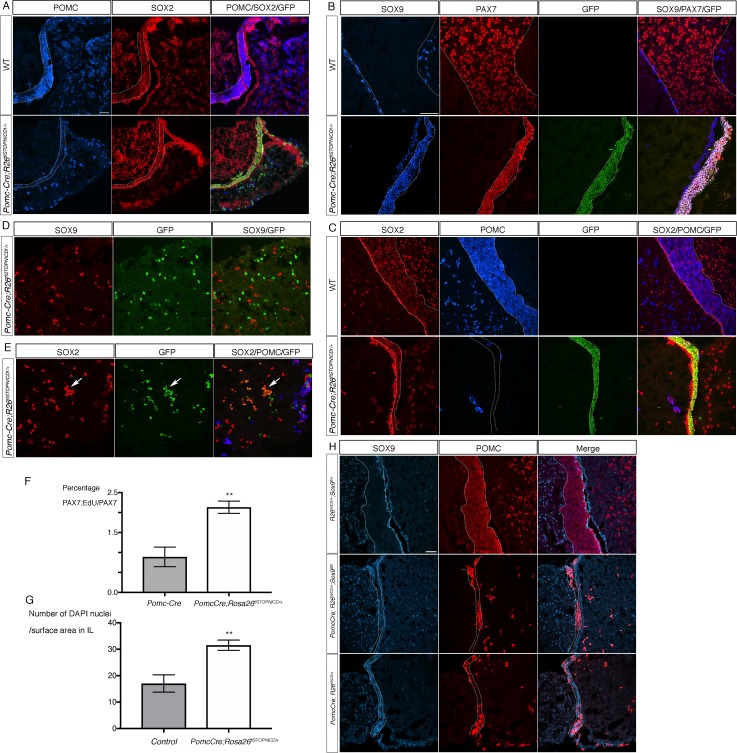
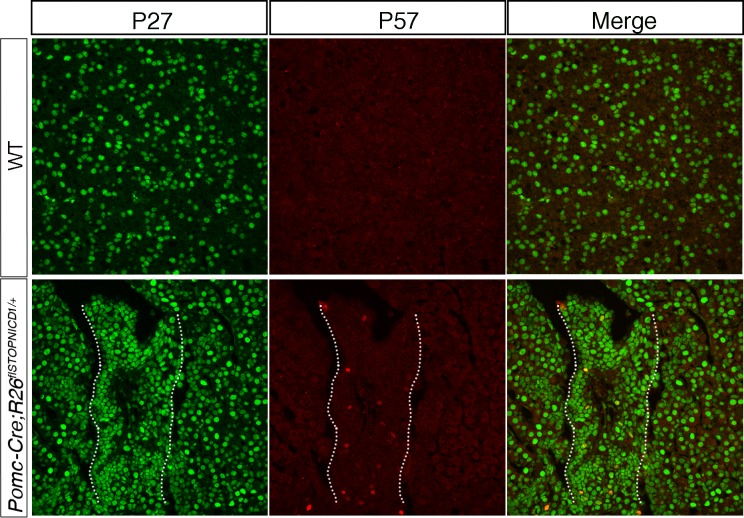
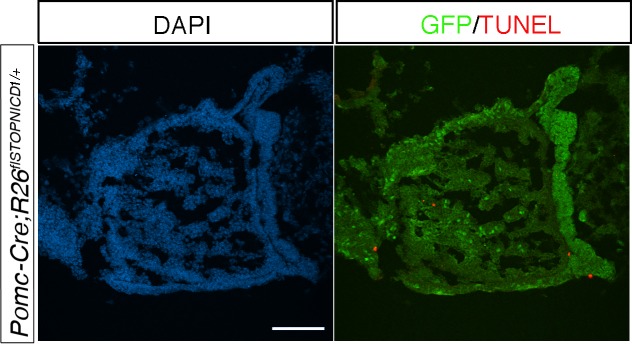
Figure 7. Activation of NOTCH pathway in the POMC lineage results in regression of melanotrophs and corticotrophs toward a progenitor-like fate post-natally.
(A) Immunofluorescence of P7 wild-type and Pomc-Cre;Rosa26flSTOPNICD1/+ pituitaries. Expression of POMC is dramatically down-regulated in IL and NICD1iresGFP positive corticotrophs in AL. SOX2 staining appears of similar intensity in both IL and SCs in mutants, while in control its expression is clearly lower in IL melanotrophs compared to SCs. (B, C) Immunofluorescence of 4 month-old wild-type and Pomc-Cre;Rosa26flSTOPNICD1/+ IL. There is a clear co-localisation of PAX7 and SOX9 in mutant IL that is never observed in wild-type samples (B). POMC expression is almost absent in the SOX2 positive IL cells in mutants (C). In addition, IL is thinner in mutants, while cell density appears increased. (D, E) Immunofluorescence of 4 month-old wild-type and Pomc-Cre;Rosa26flSTOPNICD1/+ AL. In contrast with what is observed in IL, SOX9 is not expressed in AL NICD1iresGFP positive cells (D), but SOX2 is ectopically induced in the mutant cells (arrow, E). (F) Analysis of cell proliferation in PAX7 positive cells at P2. Pups were injected with EdU and pituitaries harvested one hour later. There is a significant increase in cell proliferation in Pomc-Cre;Rosa26flSTOPNICD1/+ PAX7 positive cells (n = 3 to 4 pups/genotype, unpaired t test performed, p=0.0013 is calculated after angular transformation of percentages). (G) Analysis of cell density in 5 month-old IL (n = 3 to 4 pituitaries/genotype, unpaired t test performed, p=0.0011). (H) Immunofluorescence for SOX9 and POMC in 3 week-old pituitaries. Despite loss of ectopic SOX9 expression in Pomc-Cre;Rosa26flSTOPNICD1/+;Sox9 fl/fl POMC expression is still down-regulated in the hypoplastic IL. Scale bar represent 50 μm in A, H and in B for C-E. IL is underlined.


