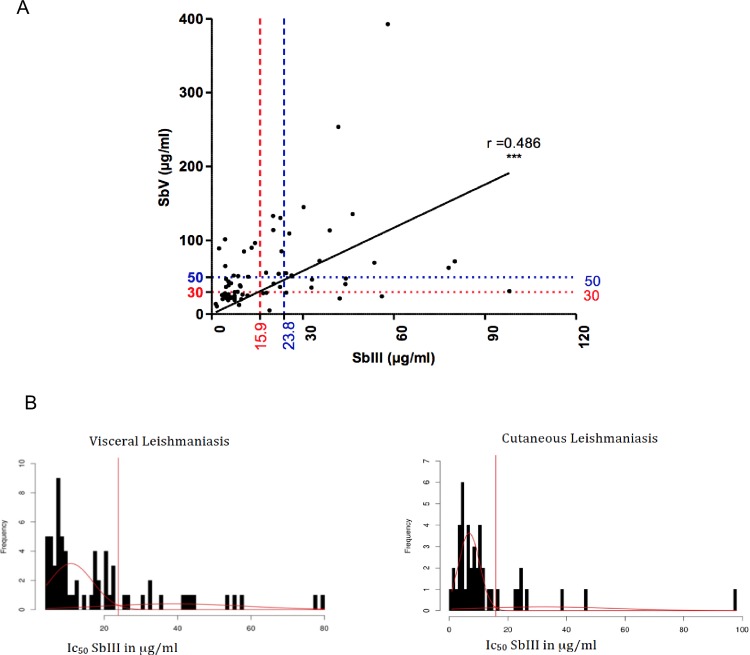
Fig 4. Correlation between susceptibilities of promastigotes and intracellular amastigotes to Sb(III) and Sb(V), respectively.
Correlation between Sb(III) and Sb(V) susceptibilities (A). Dached vertical line materialize Sb(III)-ECOFF values for VL (blue) and CL (red) isolates. Horizontal lines represent cut-off (ECOFF) values for Sb(V) which are deduced via projection of Sb(III)-ECOFF values on the Sb(V) IC50 ordonate axis according to the regression curve. Determination of the epidemiological cutoff values for Sb(III) (Sb(III)-ECOFF) of isolates responsible for VL and CL (B).

