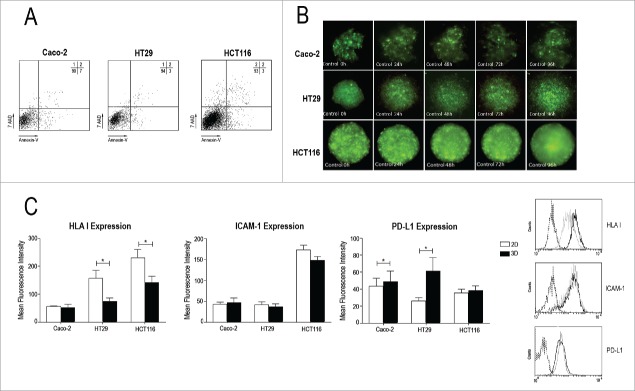
Figure 1.
Spheroid characterization. (A) Dot-Plot of a representative spheroid control showing the percentage of viable cells after 4 days (Ann-V−/AAD−) for the three cell lines. PS exposure on plasma membrane (annexin-V) and membrane permeabilization (7AAD) were analysed by flow cytometry as described in Material and Methods. (B) CRC spheroid area evolution in control group shows tumour progression in absence of treatment along the study time course. (C) Monocellular suspensions from 2D or 3D cultures were analysed by flow cytometry for the expression of HLA-ABC, ICAM-1 and PD-L1. Bar charts represent the Mean Fluorescence Intensity in 2D (white) and 3D (black) conditions. Histograms show a representative determination for HCT116 cell line. The dotted line corresponds to isotype control, the black line to 2D conditions and the grey line to 3D conditions. Data in the graphics are represented as the mean±SEM of at least 5 independent experiments where duplicate measures were determined as described in Materials and Methods. n.s. no statistically significance or *p<0.05, **p<0.01, ***p<0.001 statistically significance was analysed by t-test.

