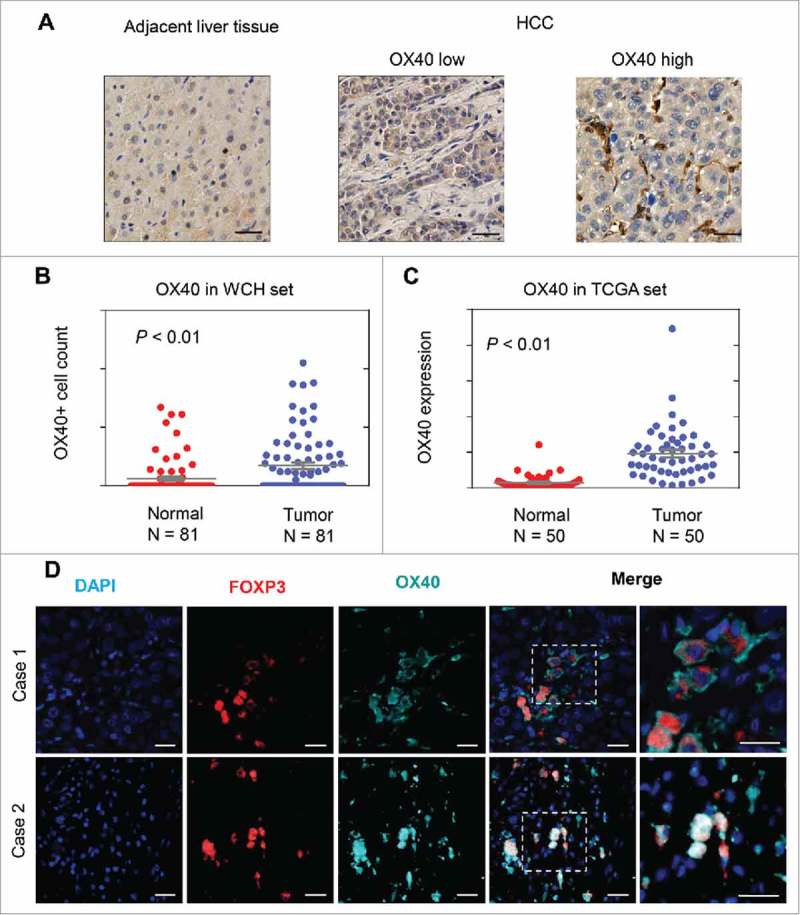
Figure 1.

OX40 is differentially expressed in HCC and adjacent liver tissues. (A) Immunohistochemical staining showing higher OX40 expression in HCC than adjacent liver tissues. (Scale bars: 50 μm) (B) Scatter plot showing more OX40 positive cell counts in HCC than adjacent liver tissue from the WCH set; the Y-axis is the number of OX40 positive cells. (C) Scatter plot showing the higher OX40 mRNA level in HCC than in adjacent liver tissue in the TCGA set; the Y-axis is the OX40 mRNA expression measured by RNA sequencing. (D) Three-color immunofluorescence microscopy was used to analyze the distribution of tumor-infiltrating Tregs expressing OX40. Representative images from two cases showing the expression of OX40 (cyan) on FOXP3+ (red) T cells. (Scale bars: 20 μm).
