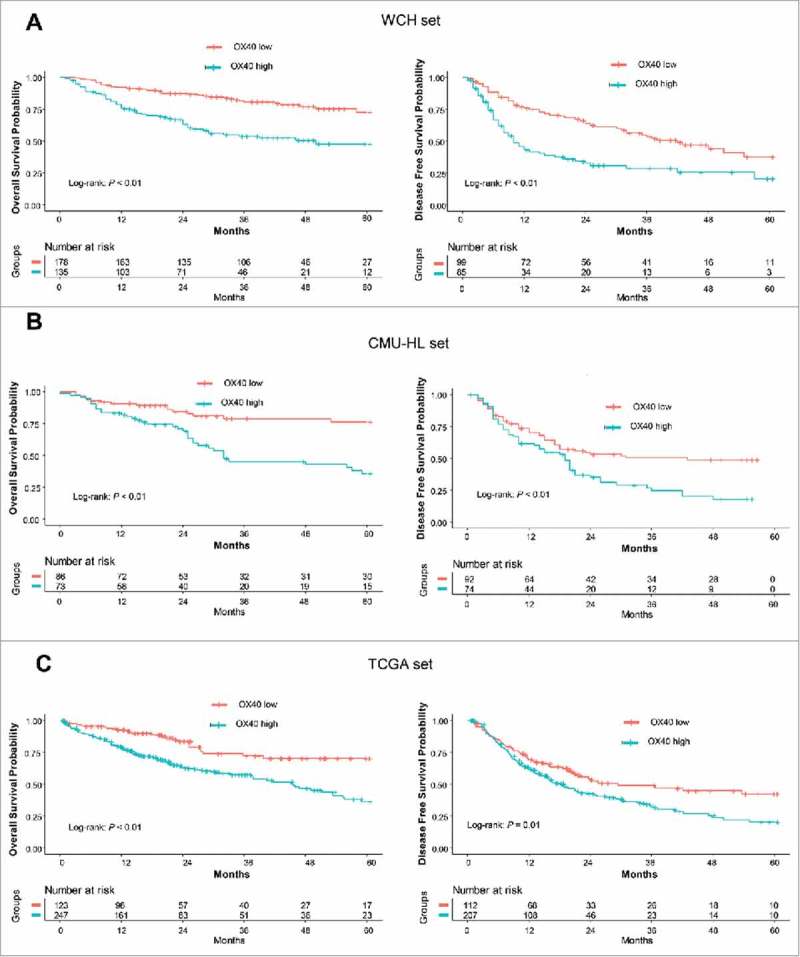
Figure 3.

Prognostic significance of OX40 expression. (A) OS (left) and DFS (right) curves for the high- and low-OX40 expression groups in the WCH set. Log-rank test P values and life tables are also shown. (B) OS (left) and DFS (right) curves for the high- and low-OX40 expression groups in the CMU_HL set. (C) OS (left) and DFS (right) curves for the high- and low-OX40 expression groups in the TCGA set.
