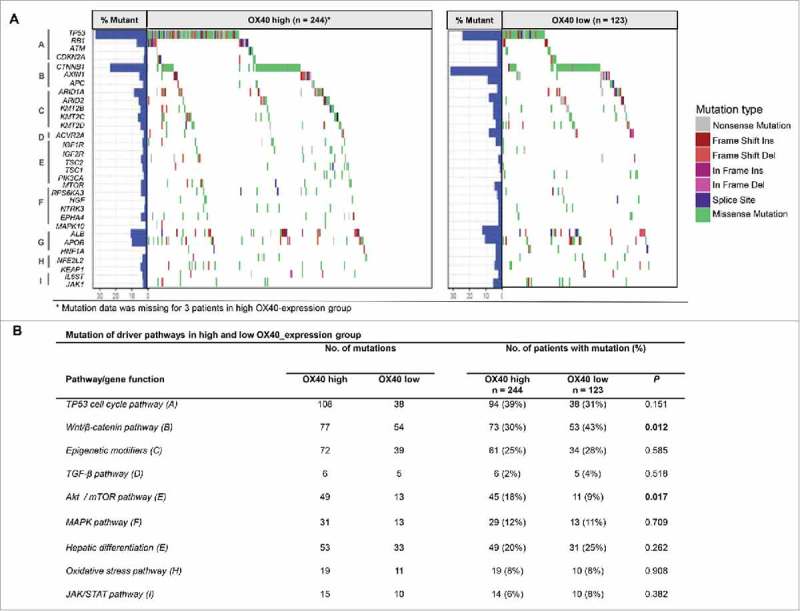
Figure 5.

Pathway-based gene mutations in high- and low-OX40 expression samples. (A) Waterfall plot of mutated genes in high- and low-OX40 expression tumors. Gene mutations were ordered by distinct pathways: A indicates the TP53 cell cycle pathway; B, the Wnt/β-catenin pathway; C, epigenetic modifiers; D, TGF-β signaling; E, the Akt/mTOR pathway; F, the MAPK pathway; G, hepatic differentiation; H, the oxidative stress pathway; and I, JAK/STAT signaling. Each column represents a sample. Boxes with different colors indicate different types of non-synonymous mutations. (B) Numbers of mutations and numbers of patients with or without mutations in high- and low-OX40 expression groups. P values of the univariate analysis are also shown.
