
Figure 5.
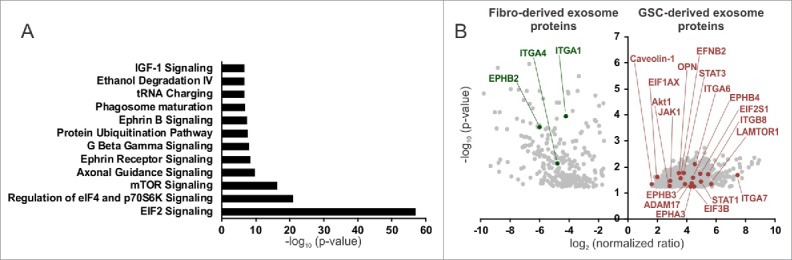
Proteomic analysis of GSC- and fibroblast-derived exosomes. (A) Pathway annotation of the GSC-derived exosome (GSC20, 17, 267) proteins vs. fibroblast-derived exosome (MRC5, WI38) proteins (fold change > 4, P < 0.05). The –log (P value) for each pathway is listed. (B) A volcano plot of protein enrichment in samples from fibroblast- (MRC5, WI38) and GSC-derived exosomes (GSC20, 17, 267). Only the statistically significant results (P < 0.05) are shown.