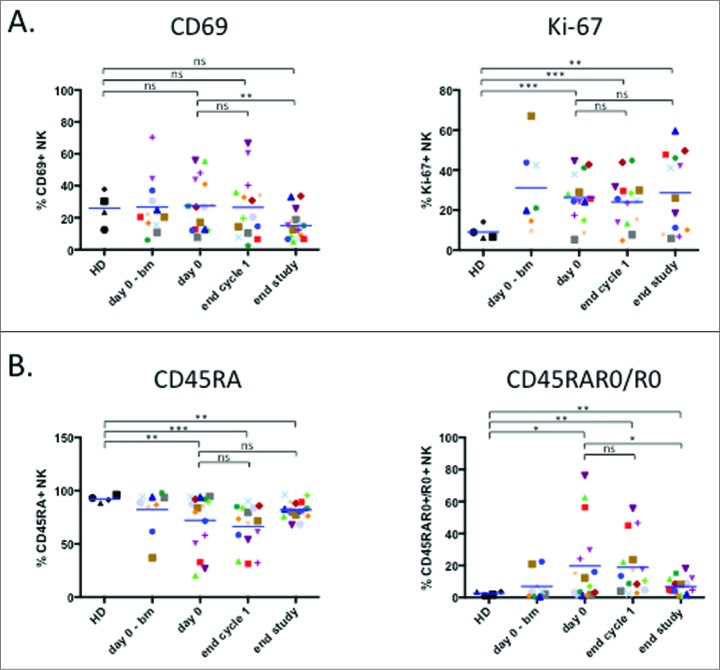
Figure 3.
Treatment decreases the activated NK cell population. (A) Proliferation potency of NK cell presented as intracellular staining of the nuclear marker Ki-67 and NK activation status determined by expression of the activation marker CD69. (B) Analysis of NK populations based on differential expression of CD45 isoforms: CD45RA+ (left panel) and CD45RA+R0+ plus CD45R0+ (right panel). Patient: n = 16, healthy donor: n = 4. Significance was determined by paired t-test between day 0 versus following time-points, and one-way ANOVA between HD and patients at every time-points with * p ≤ 0.05, ** p ≤ 0.01 and *** p ≤ 0.001.

