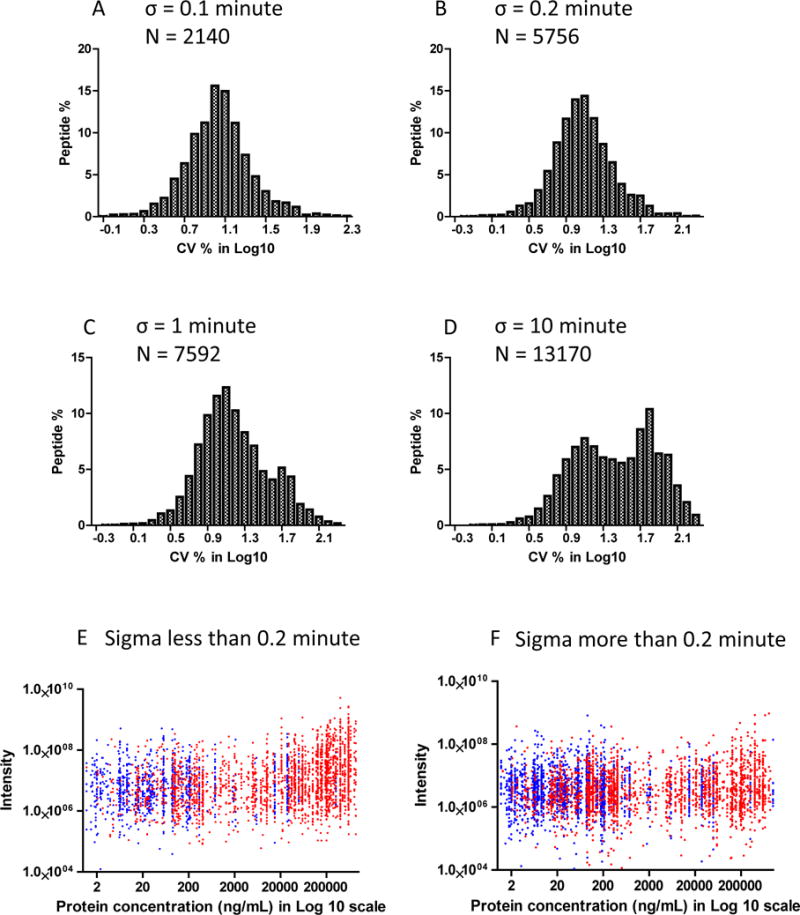
Figure 4.

A) to D) Frequency distribution histogram for the variation of plasma peptides quantified within 4 analytical replicates with different retention time variations (sigma value): A) less than 0.1 minute, B) less than 0.2 minute, C) less than 1 minute, and D) less than 10 minutes. A singular distribution was observed for quantification of peptides with small retention time variations. A bimodal distribution started to emerge when retention time variations were increased to greater than 1 minute. N indicates the number of quantified peptides with the corresponding criterion. For the proteins with known plasma concentration, E) and F) illustrate the correlation of the peptide intensity and protein concentration: E) peptides with σ ≤ 0.2 min, F) peptides with σ > 0.2 min. Red dots represent the peptides from extracellular proteins with known concentrations. Blue dots represent the rest of the peptides.
