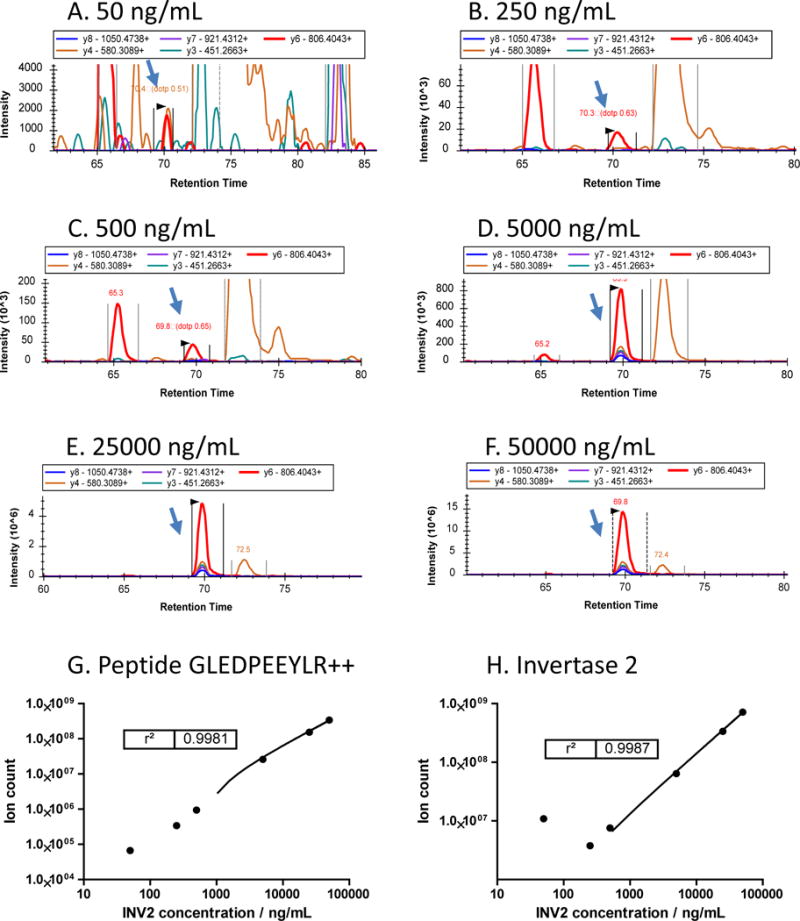
Figure 5.

The profiles of the top 5 fragments (b and y ions with m/z more than 200) from peptide GLEDPEEYLR++ (Invertase 2) at different spiked-ion concentrations: A) 0.05 μg/mL, B) 0.25 μg/mL, C) 0.5 μg/mL, D) 5 μg/mL, E) 25 μg/mL, F) 50 μg/mL. G) Dynamic range for peptide GLEDPEEYLR++, and H) dynamic range for Invertase 2 summed from the 6 quantifiable peptides. Blue arrow indicates the target peaks from peptide GLEDPEEYLR++.
