
Fig 5.
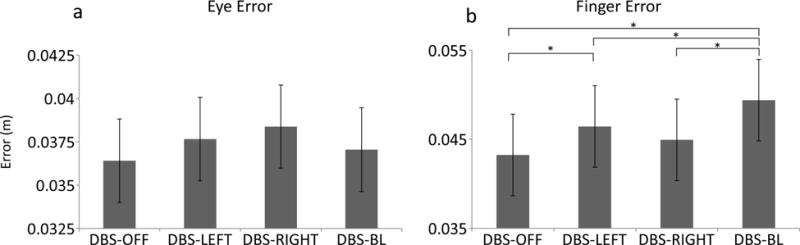
These plots show the estimated mean (± standard error) for eye error (a) and finger end-point error (b) for all stimulation conditions. * indicate significant differences between stimulation conditions.
Official websites use .gov
A
.gov website belongs to an official
government organization in the United States.
Secure .gov websites use HTTPS
A lock (
) or https:// means you've safely
connected to the .gov website. Share sensitive
information only on official, secure websites.
These plots show the estimated mean (± standard error) for eye error (a) and finger end-point error (b) for all stimulation conditions. * indicate significant differences between stimulation conditions.