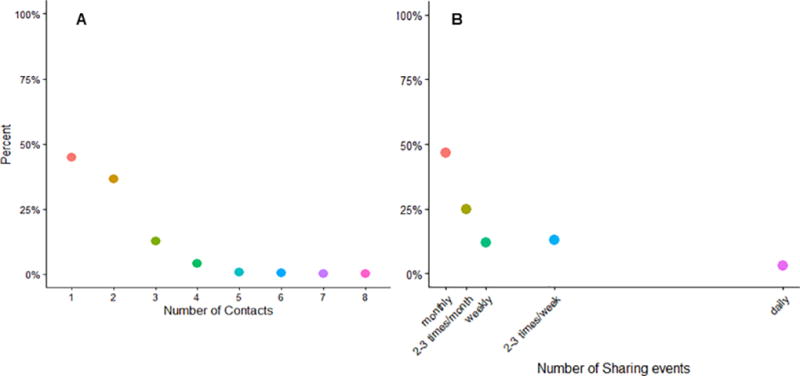
Figure 1.

A) The graphs displays the proportion of study participants that reported each number of different drug injection equipment sharing partners in the past 3 months. The figure represents survey information provided by the 1139 male PWID participants of the parent study who reported at least one sharing event during that time. B) The graph displays the proportion of study participants that reported each frequency of injection in the past 3 months. This figures represents information provided by the same 1139 male PWID participants as in panel A.
