
Figure 4.
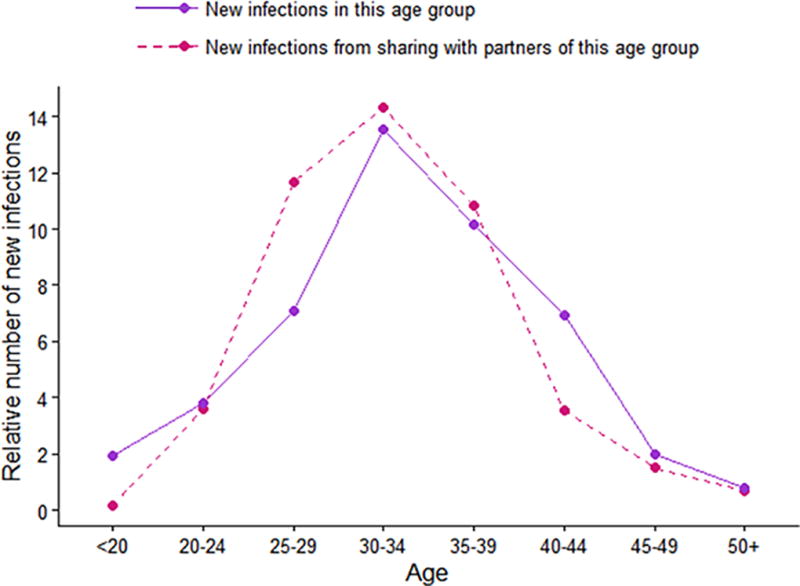
Plots show the number of new infections that one would expect to observe in the subsequent time period (i.e. following the initial 3 months of observed time) given the baseline age-specific HIV prevalence and age-dependent mixing patterns. The dotted line indicates the number of new infections that would be expected to occur as a result of contact with HIV infected individuals in the corresponding age group on the X-axis. This line is therefore indicative of the age groups that should be targeted for treatment as prevention (TasP). The solid line indicates the expected number of new infections acquired by the corresponding age groups on the X-axis, indicating the age groups that should be targeted for pre-exposure prophylaxis.