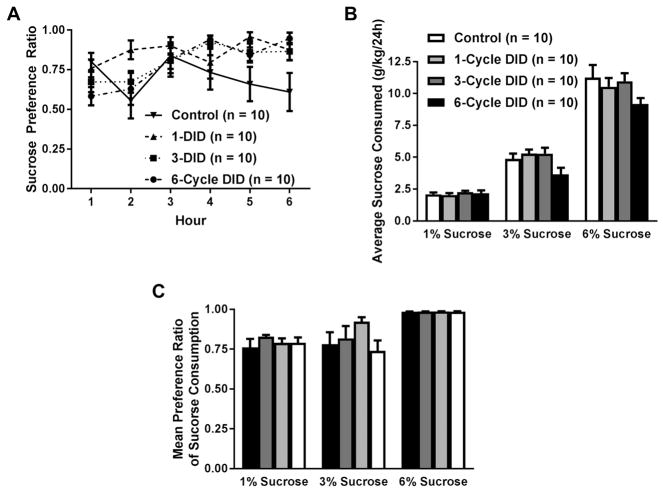
Figure 3. Average hourly sucrose preference ratio (sucrose intake/total fluid intake) and daily sucrose consumption in groups of mice that drank water (control) or had a prior history of 1, 3, or 6 cycles of DID.
A prior history of binge-like ethanol drinking did not alter sucrose preference during the anhedonia test (A). No effect of ethanol experience was observed on sucrose consumption, but animals with access to 6% sucrose consumed more sucrose than the other concentrations (B). Moreover, all animals preferred the sweet taste of high concentration of sucrose (6%) more than either of the other two concentrations regardless of DID history (C). All values are means ± SEM.

