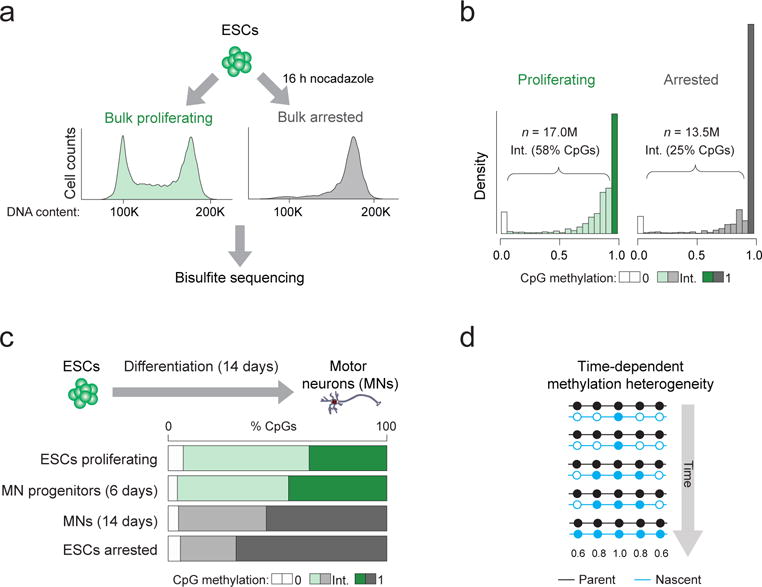
Figure 2. Mitotically arrested cells show reduced intermediate CpG methylation suggesting time-dependent methylation heterogeneity.

(a) ESCs were grown in either normal (“proliferating”) culture conditions (green) or in the presence of the mitotic inhibitor nocodazole for 16 h (“arrested”; grey). The fluorescent activated cell sorting (FACS) plots show representative histograms according to DNA content (propidium iodide intensity) for cells from each experimental condition confirming the shift to G2-M phase (4N) for nocodazole treated cells (right). Genomic DNA was extracted from both conditions and bisulfite sequencing was performed. (b) Histograms displaying the distribution of CpG methylation in cells grown in proliferating and arrested conditions. Intermediate (Int.) methylation (shown in intermediate shading) refers to CpGs with methylation levels other than 0 (light shading) or 1 (dark shading). (c) ESCs were differentiated towards post-mitotic motor neurons (MNs) and samples on day 6 and 14 were analyzed by WGBS to determine the proportion of CpGs with intermediate methylation levels. (d) Simplified schematic illustrating a hypothetical scenario of methylation heterogeneity arising from a lag in maintenance methylation following DNA synthesis. The grey arrow indicates time during S-phase. In an unsynchronized population, cells exist in all stages of S-phase and therefore each display different methylation levels with respect to ‘time’. Nascent DNA is colored blue and is gradually methylated over time. Filled circle = methylated CpG, empty circle = unmethylated CpG. Numbers beneath indicate the expected mean methylation for the CpGs at that position based on the illustrated pattern.
