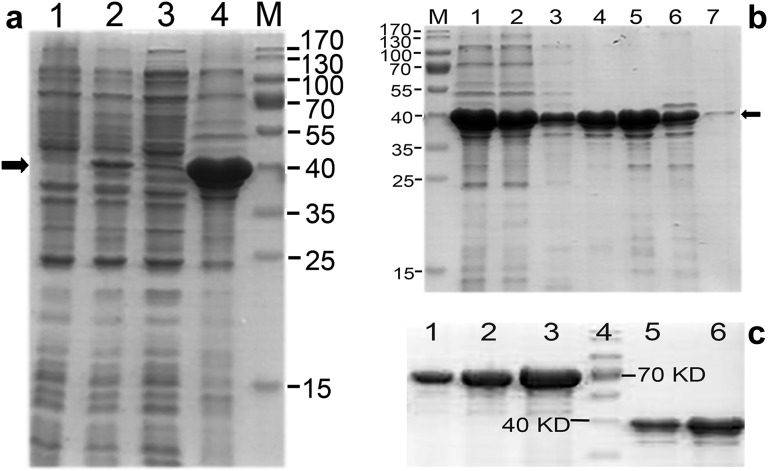
Fig. 2.
iLRP purification and quantification. a iLRP was expressed as an insoluble form of inclusion body. An induced band could be observed clearly on lane 2, but the most induced products were revealed on lane 4 loaded with inclusion bodies. Lane 1: cell lysates from the sample without IPTG induction; lane 2: sample from induced bacterial culture by 0.5 mM IPTG at 37 °C for 6 h; lane 3: supernatant from the same sample as in lane 2 lysed by ultrasonication, then centrifuging at 16,000g; lane 4: inclusion body pellet from the same sample as in lane 3 after centrifugation. The solid arrow pointed at the proper position of target protein. M: molecular weight marker. b Elution profile of Ni–NTA column loaded with solubilized inclusion bodies. Lane 1: clarified supernatant from dissolved inclusion bodies; lane 2: flow through collected from sample loading; lane 3: eluted fraction collected at 20 mM imidazole; lane 4: eluted fraction at 50 mM imidazole; lane 5: eluted fraction at 100 mM imidazole; lane 6: eluted fraction at 200 mM imidazole; lane 7: eluted fraction at 500 mM imidazole. M: molecular weight marker. The solid arrow indicated the position of target protein with a size of around 37 kDa. c Quantification by scanning densitometry. Bovine serum albumin (BSA) standards were used to determine the yield of recombinant protein. Lane 1: 1 µg of BSA was loaded; lane 2: 2 µg of BSA was loaded; lane 3: 4 µg of BSA was loaded; lane 4: molecular weight marker; lane 5: purified iLRP in 1 µL of phosphate-buffered saline; lane 6: purified iLRP in 2 µL of phosphate-buffered saline. Lane 1 and 2 had similar band density with lane 5 and 6, respectively, which meant the amount of loaded protein in lane 5 was close to 1 µg and close to 2 µg in lane 6

