Fig. 4.

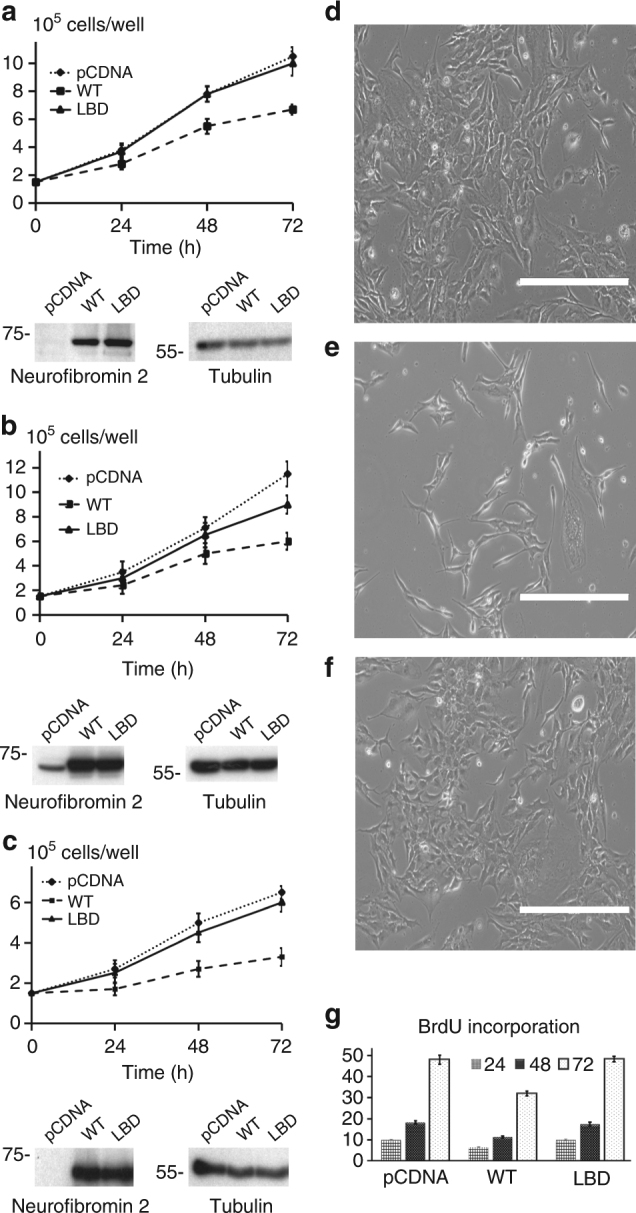
Lipid binding deficient mutants of neurofibromin 2 display impaired inhibition of cell proliferation. a SC4, b HEK293T, or c hSCλ-shNF2 cells were transfected with expression vectors for wild type and lipid binding deficient neurofibromin 2 or empty vector control (pCDNA). Total cell numbers were counted over 72 h. Means of each data point were calculated from three independent biological replicates conducted in triplicate. Error bars represent ± S.D. Immunoblot analysis was used to verify similar expression levels of the indicated neurofibromin 2 alleles. Tubulin was used as a control. The blots shown are representative of three biological replicates. For SC4 cells: difference between pCDNA and lipid binding deficient neurofibromin 2, < 0.7680 (i.e., not significant); pCDNA and wild-type neurofibromin 2, < 0.0001 (i.e., significant); lipid binding deficient and wild-type neurofibromin 2 proteins, < 0.0001 (i.e., significant). For HEK293T cells: difference between pCDNA and lipid binding deficient neurofibromin 2, <0.0013 (i.e., significant); pCDNA and wild-type neurofibromin 2, <0.0001 (i.e., significant); lipid binding deficient and wild-type neurofibromin 2 proteins, <0.0001 (i.e., significant). For hSCλ-shNF2 cells: difference between pCDNA and lipid binding deficient neurofibromin 2, <0.2476 (i.e., not significant); pCDNA and wild-type neurofibromin 2, <0.0001 (i.e., significant); the lipid binding deficient and wild-type neurofibromin 2 proteins, <0.0001 (i.e., significant). Scalebar size is 400 μm. d–f Phase contrast microscopy images, taken at the 72 h time point, of SC4 cells that were used in the BrdU cell proliferation assay. SC4 cells transfected with d pCDNA, e neurofibromin 2, and f the neurofibromin 2 lipid binding deficient mutant. g Cells expressing lipid binding deficient mutants of neurofibromin 2 display impaired inhibition of BrdU incorporation. SC4 cells were transfected with expression vectors for wild type and lipid binding deficient neurofibromin 2 or empty vector control (pCDNA) and BrdU incorporation was assessed over 72 h. Means of each data point were calculated from three independent biological replicates conducted in triplicate. Error bars represent ± S.D. Difference between pCDNA and our lipid binding deficient mutant neurofibromin 2, <1.0000 (i.e., not significant); pCDNA and wild-type neurofibromin 2, <0.000 (i.e., significant); wild type and our lipid binding deficient mutant, <0.0001 (i.e., significant)
