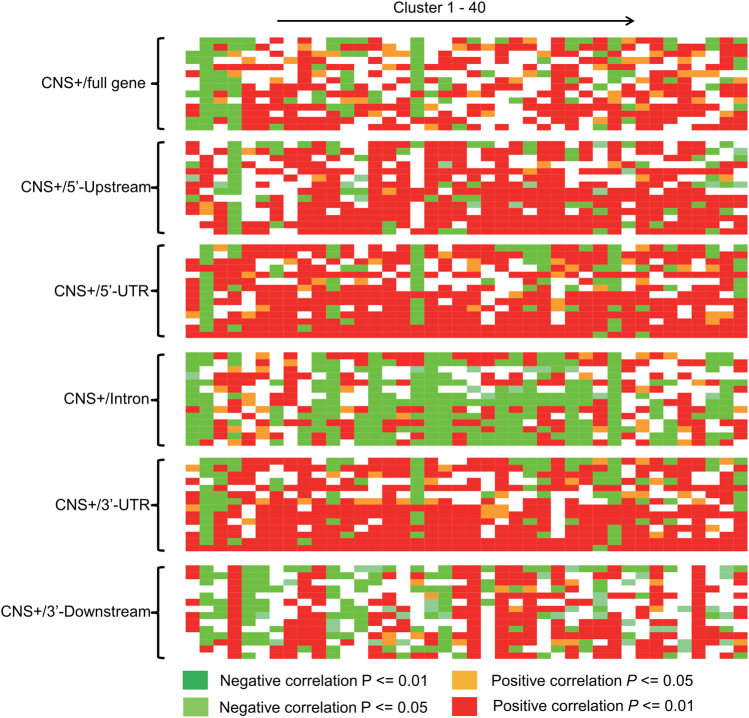
Fig. 1.
Correlation between conserved noncoding sequence (CNS) frequency and gene pair co-expression. CNS counts subdivided into sub-genic regions, including 5′ upstream, 5′ UTR, intron, 3′ UTR, 3′ downstream, or the sum of all five regions (full gene). Each row in one sub-gene position indicates the whole-genome microarray dataset of one tissue (Rodgers-Melnick et al. 2012). Each column indicates one co-expression module

