Fig. 3.
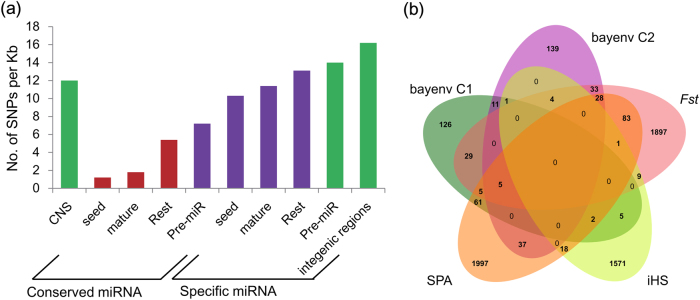
Unique and shared CNSs among five selection scans. a The SNP frequency in distinct sequence contexts. The SNP frequency (no. of SNPs per kb) were compared across different noncoding sequences, including conserved miRNAs (seed regions, mature regions, the rest of the miRNA excluding the seed regions (Rest) and hairpins), Populus-specific miRNAs, and intergenic regions. The miRNA data were derived from a previous study (Xie et al. 2017). b Venn diagram of the number of CNSs through the genome in the top 1% for each selection scan using five different metrics: Fst, SPA, iHS, bayenv C1, and bayenv C2. The detected genomic regions were derived from the previous study (Evans et al. 2014). The CNSs show lower SNP frequency than Populus-specific pre-miR sequences and some of them are located in the genome selection regions, suggesting that a substantial fraction of CNSs experience selection pressure

