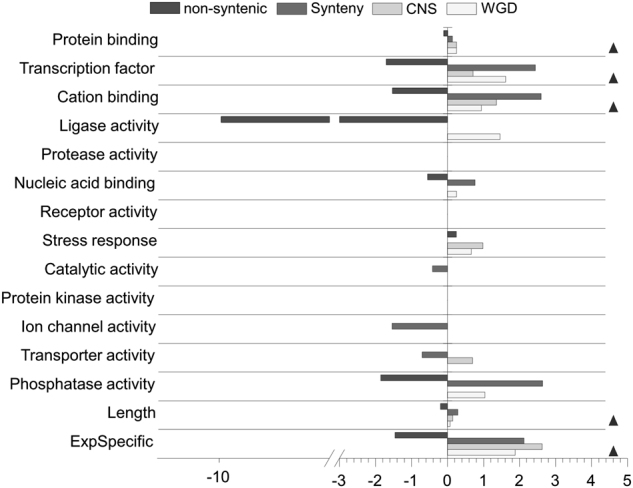
Fig. 5.

The exponentiated logistic regression coefficients for categories significant for syntenic, non-syntenic, CNS-associated genes, and WGD. Black triangles indicate categories that were associated with similar trends of the three genome evolution categories, including WGD, CNS, and Synteny. ExpSpecific indicate the tissue specificity
