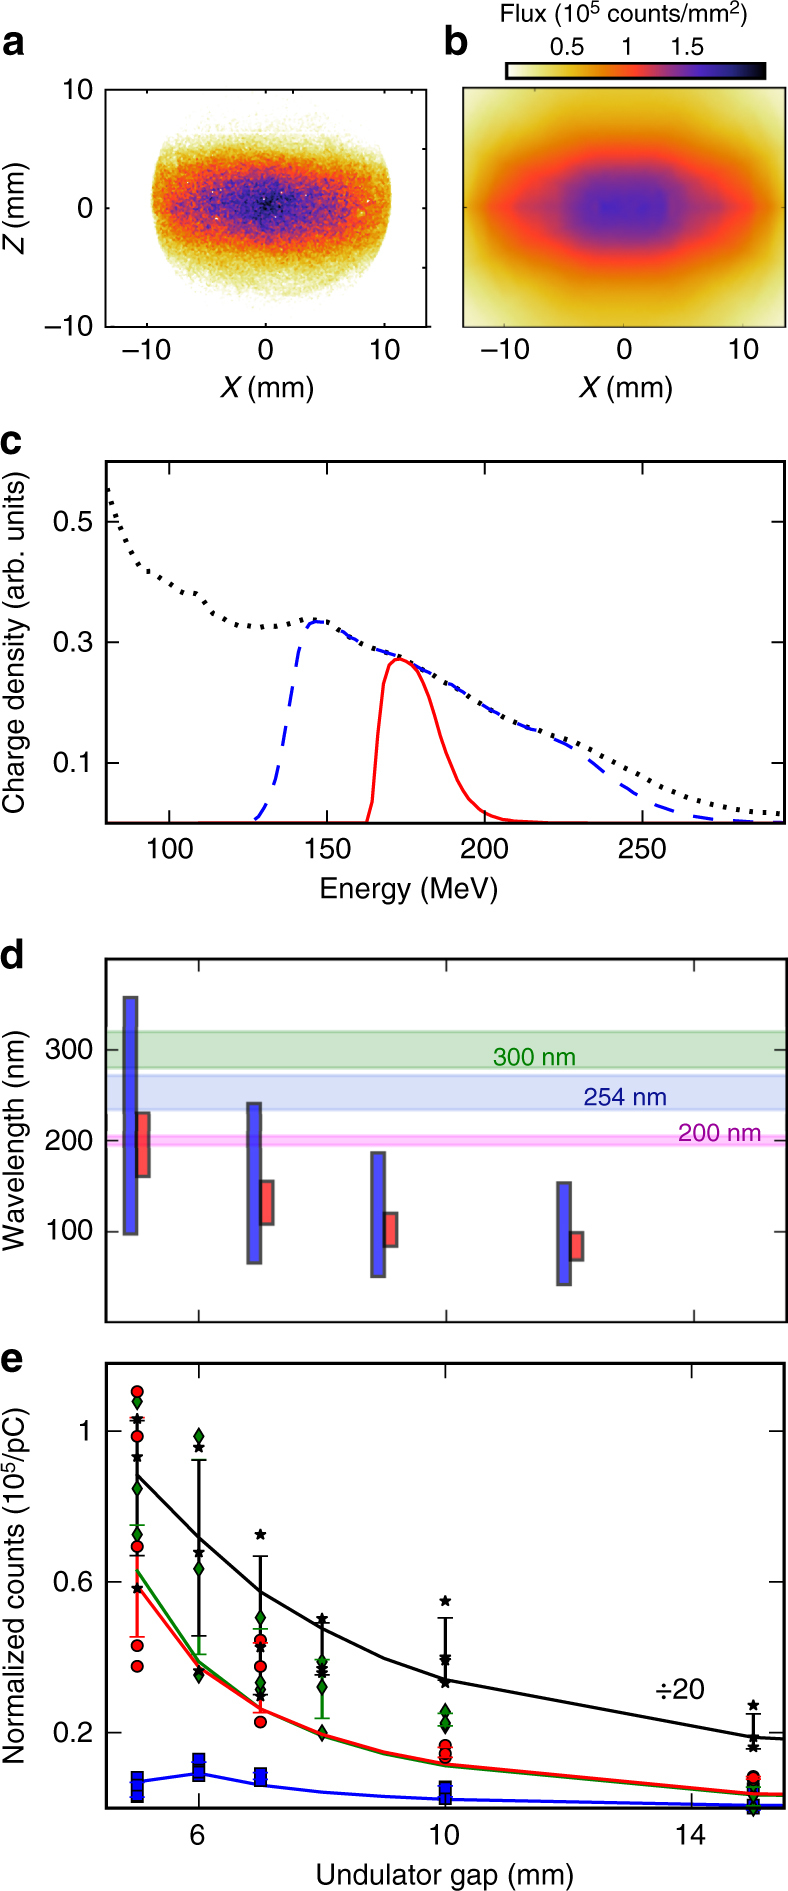
Fig. 7.

Observation of undulator radiation. Measurement (a) and numerical modelling (b) of the radiation flux density normalised to 1 pC (without slit, bandpass filters and focusing lens). c Spectrum measured at the exit of the electron source (dotted), and simulated at the entrance of the undulator after transport in the line (dashed), with the 4 mm slit (solid curve). d On-axis resonant wavelength ranges without (blue) and with (red) slit, with electrons below 10% of the maximum charge excluded and spectral FWHM bandwidth of the optical filters. e Total photon count measured by a camera with a lens and normalised by the beam charge black stars: without slit and bandpass filter, downscaled by a factor 10; with a 4 mm slit, red circles: 300 nm, green diamonds: 253 nm, blue squares: 200 nm filter. Error bars: mean values and deviations of acquired data sets, solid curves: numerical simulation
