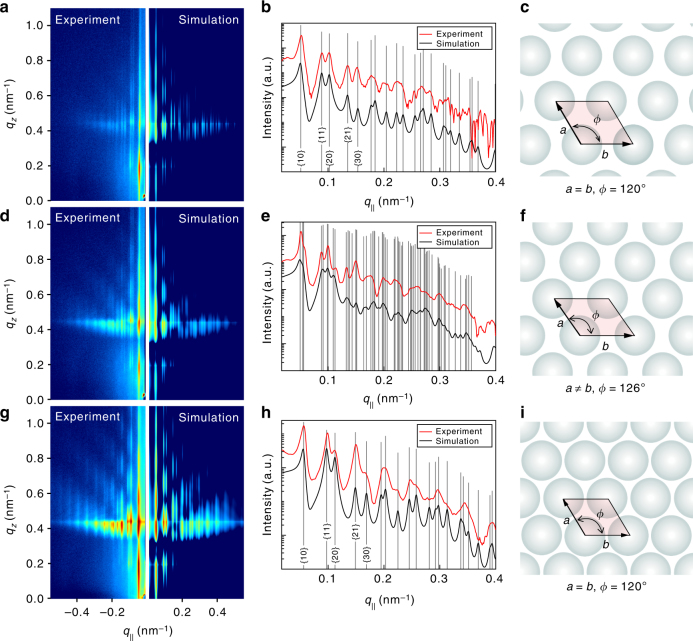
Fig. 3.
GISAXS data analyses and in-plane superlattice structures. a, d, g Experimental GISAXS patterns (left) compared with their corresponding simulated patterns (right). The GISAXS data are recorded at the surface pressures of 0.2, 10.4, and 17.6 mN m−1 and the corresponding areas per particle of 2.82 × 10⁻², 2.30 × 10⁻², and 2.13 × 10⁻² μm2, respectively, (marked as diamonds in Fig. 1c). b, e, h The experimental (red solid lines) and simulated (black solid lines) 1D scattering profiles are extracted from the corresponding GISAXS patterns (i.e., a, d, g), along the q∥ direction around qz = 0.434 nm−1 (the Yoneda peak of water). Each gray line identifies a Bragg diffraction peak. c, f, i Schematic diagrams of the superlattice structures obtained from the theoretical simulations

