Figure 3.
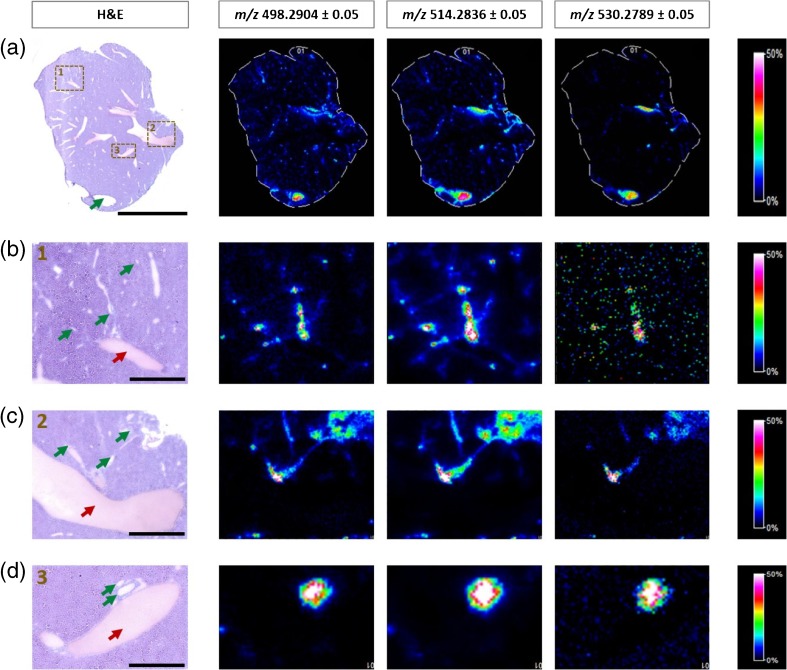
MS ion images representing spatial distributions of the identified taurine-conjugated bile acids at m/z 498.2904 ± 0.05 (TCDCA), m/z 514.2836 ± 0.05 (TCA/TMCA), and m/z 530.2789 ± 0.05 (TTHBA) for the whole section of mouse liver at low spatial resolution (pixel size, 70 μm) (a), and in smaller sub-regions of an adjacent tissue section at high spatial resolution (pixel size, 25 μm) (b–d). All ion images were normalized to the 9-AA matrix signal. The green arrows indicate gall bladder (a) or bile vessels (b–d), whereas the red arrows show blood vessels. Scale bars: 5 mm (a), 1000 μm (b, c), and 500 μm (d)

