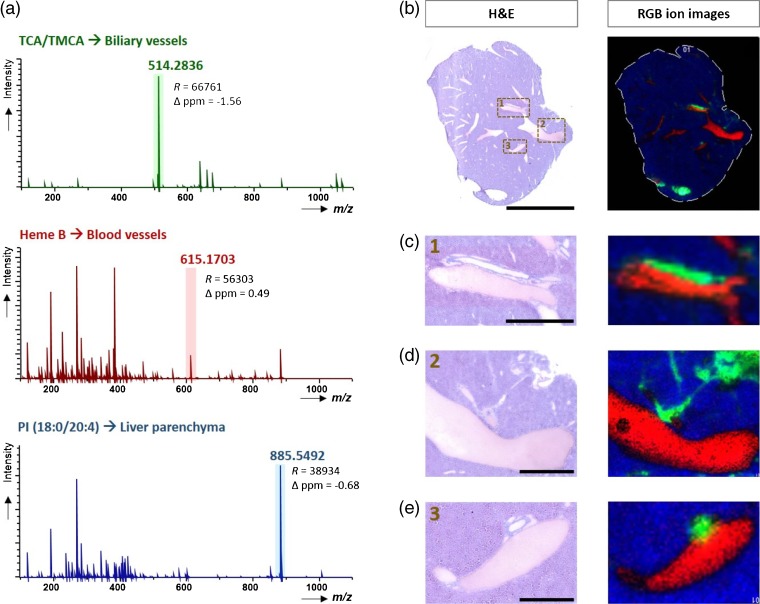
Figure 4.
MALDI-MSI single pixel mass spectra from three regions of liver tissue section with different microstructures and chemical compositions: biliary tree (bile duct), blood vessel, and liver parenchyma. The m/z values used for RGB MS images are highlighted in the spectra (a). RGB ion images representing three different compounds, showing clear distinction between anatomical features (as shown by the H&E stained images) across the whole tissue section (pixel size, 70 μm) (b). Expansion of the smaller sub-region (c) as well as smaller sub-regions from an adjacent section (pixel size, 25 μm) (d, e). Scale bars: 5 mm (b), 1000 μm (c, d), and 500 μm (e)

