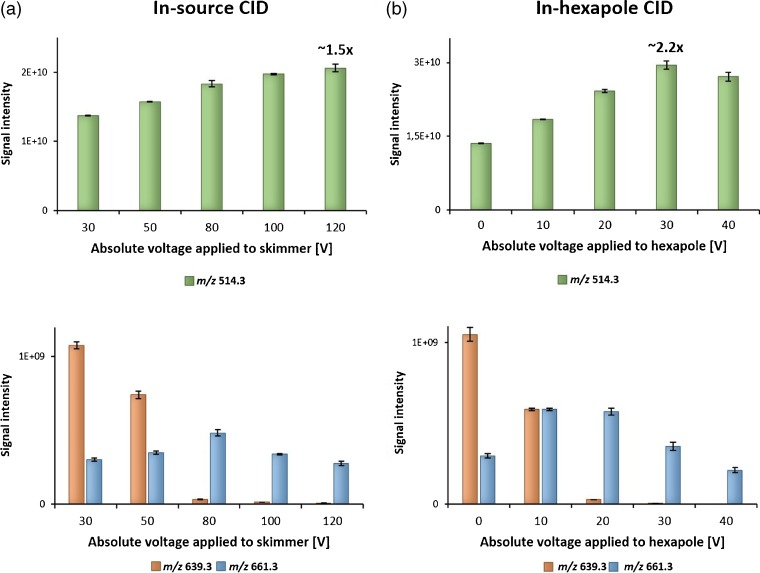
Figure 6.
Bar chart showing signal intensities for three different m/z values, m/z 514.3 (deprotonated TCA), m/z 639.3 (mixed dimer of TCA and taurine), and m/z 661.3 (sodiated dimer of TCA and taurine) obtained by direct infusion ESI-FTICR and two different approaches for CID: in-source CID (increasing voltage applied to skimmer) (a) and in-hexapole CID (b)

