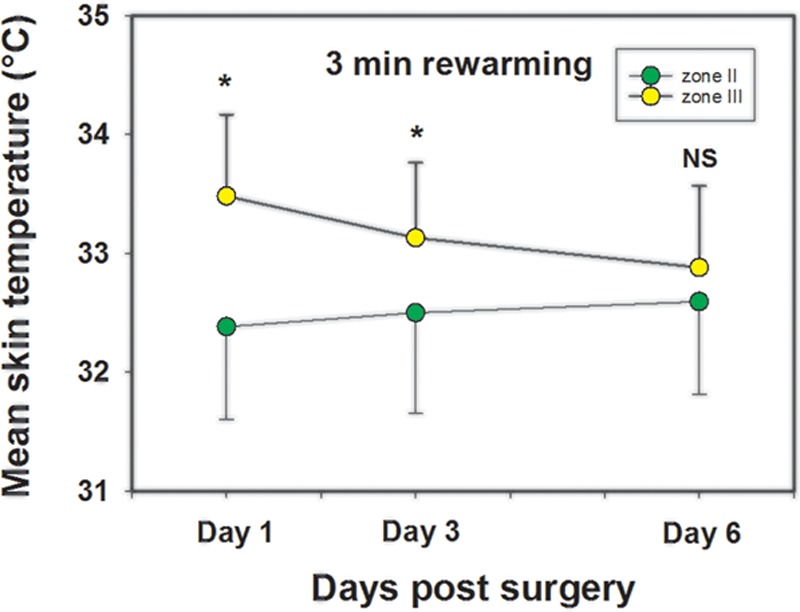
Fig. 4.

A comparison of the mean skin temperature of zones II and III 3 minutes after rewarming after a mild cold challenge on postoperative day 1, day 3, and day 6. The figure shows how the mean skin temperature in zone III settles down during the postoperative days, whereas the mean skin temperature in zone II increases at the same time supporting the qualitative findings seen in these two zones. Statistically significant differences indicated by *. NS, not statistically different.
