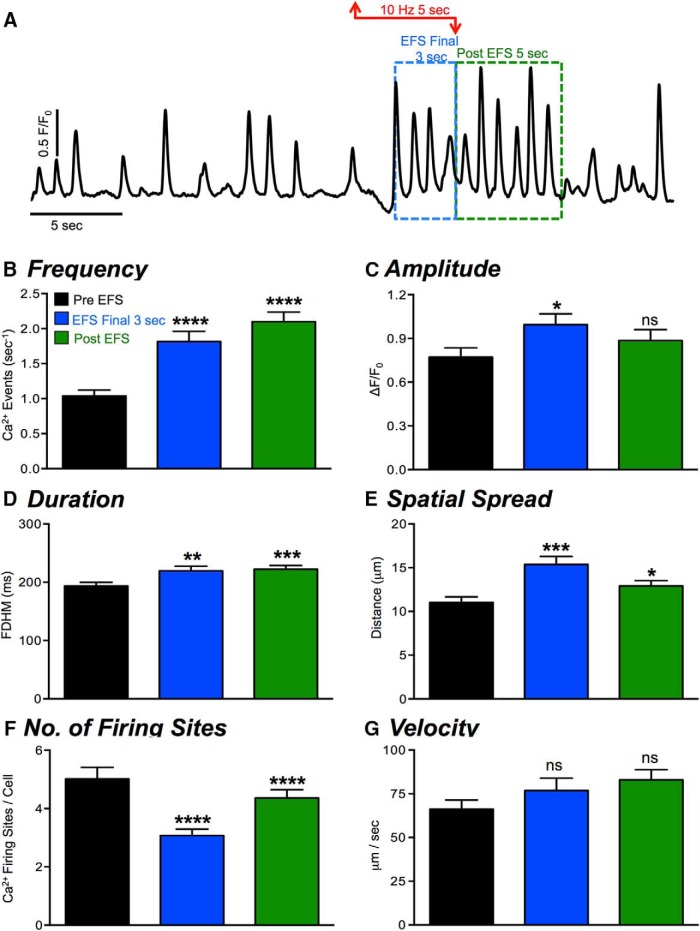
Figure 2.
Effects of nerve stimulation (EFS) on Ca2+ transients in ICC-DMP. A, Representative trace representing Ca2+ transients in ICC-DMP in response to EFS (10 Hz; 5 s). The period of EFS is indicated by the red arrowed line. Excitatory responses during the final 3 s of EFS, indicated by the dashed blue box, and during the post-EFS period (5 s), highlighted by the green box. B–G, Summary data quantifying the effects of EFS on ICC-DMP: Ca2+ transient frequency (E), amplitude (F), duration (G), spatial spread (H), number of Ca2+ firing sites (I), and Ca2+ transient velocity (J) were analyzed and shown; n = 23, c = 56. All statistical analyses shown are compared to control values; ns = p > 0.05, *p < 0.05, **p < 0.01, ***p < 0.001, ***p < 0.0001.

