Fig. 1.

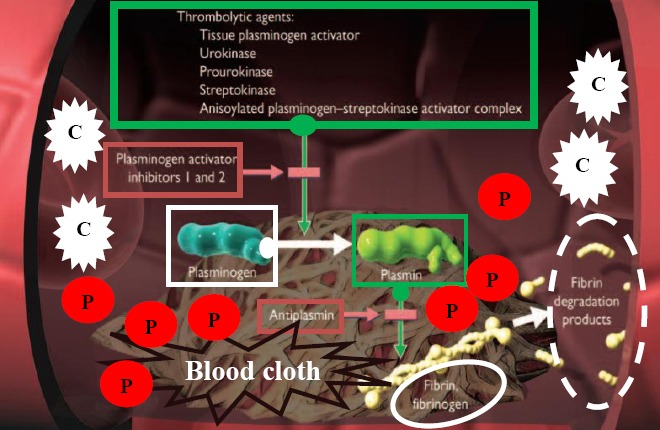
Schematic diagram of blood clot (thrombus) lysis by thrombolytic agents via plasminogen activation in a typical vein. White blood cells are indicated by “C”, and platelets entrapped within blood cloths are shown by “P”.

Schematic diagram of blood clot (thrombus) lysis by thrombolytic agents via plasminogen activation in a typical vein. White blood cells are indicated by “C”, and platelets entrapped within blood cloths are shown by “P”.