
Fig. 2.
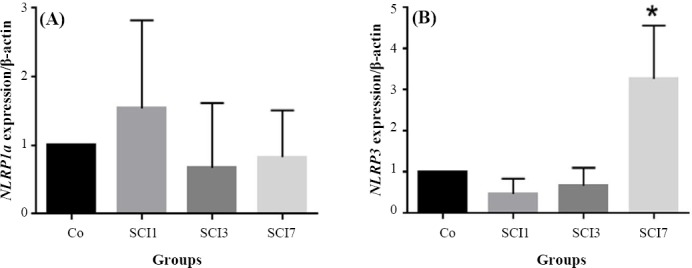
Evaluating the expression of NRPL1a and NRPL3 in rat testes after induction of SCI. Co, control group; SCI1, group sacrificed on day one after induction of SCI; SCI3, group sacrificed on day three after induction of SCI; SCI7, group sacrificed on day seven after induction of SCI. * p < 0.05 compared to the control group