
Fig. 6.
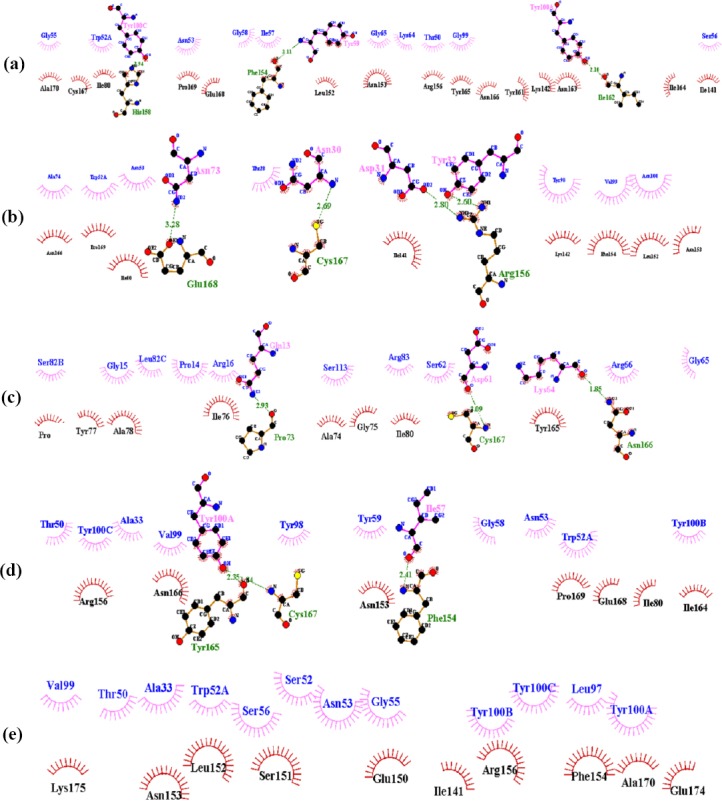
Docked positions indicated using LIGPLOT software. The plots report the non-bonded contact probability for each residue and separately, for its side chain and its main chain. Interaction of (a) wild antibodies, (b) variant 1, (c) variant 2, (d) variant 3, and (e) variant 4.