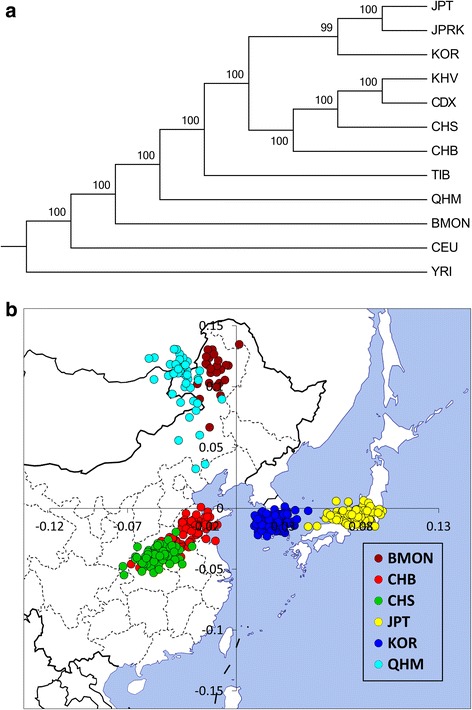
Fig. 2.

Population level phylogenetic Tree and Principal component analysis (PCA). (A) The maximum likelihood tree was constructed based on pair-wise FST matrix. And the marked number are bootstrap value; (B) The top two PCs of individuals representing six East Asian populations, mapped to their corresponding geographic locations (generated by R 2.15.2 and Microsoft Excel 2010)
