Fig. 3.

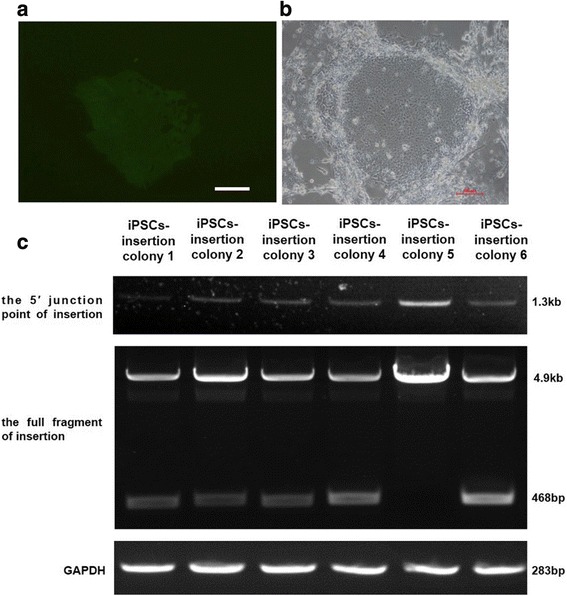
Insertion of F9 cDNA into AAVS1 locus of HB iPSCs. a Surviving cells grew large in the GFP group after puromycin selection. b Surviving cells (colony 5) grew large in the F9 group after puromycin selection. c Primers F2, R2 used to detect 5′ junction point of insertion. A 1.3-kb fragment could be seen in all iPSC colonies; primers F1, R1 used to detect the full fragment of insertion. The 468-bp and 4.9-kb fragments could be seen in iPSC colonies 1, 2, 3, 4 and 6; while only a 4.9-kb fragment could be seen in iPSC colony 5, there was no 468-bp fragment. GAPDH was amplified as internal control of amount of genomic DNA. A 283-bp fragment of same intensity could be seen in all iPSC colonies. All scale bars represent 100 μm. iPSC induced pluripotent cell, GAPDH glyceraldehyde 3-phosphate dehydrogenase
